Wacom 2012 Annual Report Download - page 13
Download and view the complete annual report
Please find page 13 of the 2012 Wacom annual report below. You can navigate through the pages in the report by either clicking on the pages listed below, or by using the keyword search tool below to find specific information within the annual report.-
 1
1 -
2
-
 3
3 -
 4
4 -
 5
5 -
 6
6 -
 7
7 -
 8
8 -
 9
9 -
 10
10 -
 11
11 -
 12
12 -
 13
13 -
 14
14 -
 15
15 -
 16
16 -
 17
17 -
 18
18 -
 19
19 -
 20
20 -
 21
21 -
 22
22 -
 23
23 -
24
 |
 |

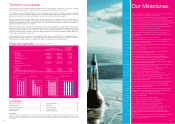
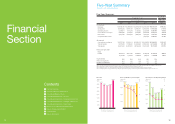
Our financial position
Total assets increased by ¥7.04bn to ¥34.13bn compared to
the end of the previous year. The main reasons were a
¥2.96bn increase in notes and accounts receivable, a
¥1.52bn increase in cash and cash equivalents, and a
¥1.01bn increase in merchandise and finished goods.
Total liabilities increased by ¥6.60bn to ¥15.21bn compared
with the end of the previous year. The main reasons for the
increase were a ¥4.31bn in notes and accounts payable and
a ¥1.15bn in income tax payable.
Total net assets increased by ¥0.44bn to ¥18.92bn. The main
reason for the increase was a ¥2.18bn of net profit despite the
decrease due to a ¥1.21bn payment of shareholders’
dividends and a ¥0.44bn repurchase of own shares.
Consolidated cash & cash equivalents increased by ¥1.52bn
(¥1.90bn decrease in the previous year) to ¥11.97bn
compared to the end of the previous year.
(Cash Flow from Operating Activities)
Earned operating cash flow gained was ¥4.88bn (¥1.18bn
gained in the previous year). The main reasons for the
increase were a ¥3.50bn in the sum of NPBT and a ¥4.35bn
increase in accounts payable despite a ¥3.12bn increase in
account receivable.
(Cash Flow from Investing Activities)
Investing cash flow expended was ¥1.70bn (¥1.47bn
expended in the previous year). The main reasons were the
purchase of the ERP system for ¥0.87bn in software, the
purchase of molds of ¥0.53bn in fixed assets, and the
purchase of ¥0.17bn for investment securities.
(Cash Flow from Financing Activities)
Financing cash flow expended was ¥1.63bn (¥1.2bn
expended in the previous year). The reason was a ¥1.2bn
payment of shareholders’ dividends and a repurchase of own
shares of ¥0.44bn.
(For the year’s ended March 31)
0
1,000
2,000
Cash Dividends per Share / Payout Raito
’09 ’10 ’11’08
Cash Dividends per share(yen)
Pay out Raito(%)
60.7
3,000
60
50
40
30
20
10
29.9
48.3
2,500
3,000
61.2
3,000
3,000
’12
54.9
3,000
(Millions of yen)
(Millions of yen)
’08 ’09 ’10
’08 ’09
-2000
-1500
-1000
-500
-300
-200
-100
0
’10
’08 ’09 ’10 ’11 ’12
’11 ’12
(For the year’s ended March 31)
(For the year’s ended March 31)
(For the year’s ended March 31)
Cash f lows from operating activities
Cash f lows from investing activities
(Millions of yen)
-3,000
-2,000
-1,000
0
1,000
2,000
3,000
4,000
Cash f lows from f inancing activities
-2,676
-1,199
-511
-1,174
-1,470
’11
-1,697
’12
-805
-1,539
1,179
4,881
1,478
3,606
3,461
-1,202
-1,627
23
0
1000
2000
3000
4000
5000
Wacom Co., Ltd. and Its Subsidiaries
Consolidated Balance Sheets
The accompanying notes are an integral part of these financial statements.
24
Assets:
¥10,454,820
4,216,958
2,876,770
183,468
709,995
548,328
1,975,708
(16,335)
20,949,712
3,509,188
(1,891,644)
1,617,544
216,020
(125,043)
90,977
1,908,180
(1,417,911)
490,269
1,436,489
3,635,279
956,112
68,554
1,218,714
2,243,380
14,778
23,815
243,138
(16,599)
265,132
6,143,791
¥27,093,503
$145,637
87,293
47,295
4,599
9,889
13,477
26,480
(201)
334,469
43,102
(23,913)
19,189
2,433
(1,598)
835
27,142
(20,622)
6,520
17,465
44,009
23,121
571
6,448
30,140
2,374
168
4,283
(193)
6,632
80,781
$415,250
March 31 March 31
Thousands of yen
Thousands of
U.S. dollars
(Note 1)
2012 20122011
Current assets -
Cash and deposits (Note 9)
Notes and accounts receivable-trade (Note 5)
Merchandise and finished goods (Note 2)
Work in process (Note 2)
Raw materials and supplies (Note 2)
Deferred tax assets
Others
Allowance for doubtful accounts (Note 2)
Total current assets
Noncurrent assets -
Property, plant and equipment: (Note 2)
Buildings and structures
Accumulated depreciation
Buildings and structures, net
Machinery, equipment and vehicles
Accumulated depreciation
Machinery, equipment and vehicles, net
Tools, furniture and fixtures
Accumulated depreciation
Tools, furniture and fixtures, net
Land
Total property, plant and equipment
Intangible assets:
Software
Goodwill (Note 2)
Others
Total intangible assets
Investments and other assets:
Investment securities (Note 2)
Deferred tax assets
Others
Allowance for doubtful accounts (Note 2)
Total investments and other assets
Total noncurrent assets
Total assets
¥11,969,873
7,174,640
3,887,185
377,985
812,756
1,107,663
2,176,394
(16,480)
27,490,016
3,542,535
(1,965,429)
1,577,106
199,974
(131,317)
68,657
2,230,773
(1,694,893)
535,880
1,435,469
3,617,112
1,900,296
46,905
529,960
2,477,161
195,115
13,786
352,069
(15,861)
545,109
6,639,382
¥34,129,398