Wacom 2011 Annual Report Download - page 12
Download and view the complete annual report
Please find page 12 of the 2011 Wacom annual report below. You can navigate through the pages in the report by either clicking on the pages listed below, or by using the keyword search tool below to find specific information within the annual report.-
 1
1 -
 2
2 -
 3
3 -
 4
4 -
 5
5 -
 6
6 -
 7
7 -
 8
8 -
 9
9 -
 10
10 -
 11
11 -
 12
12 -
 13
13 -
 14
14 -
 15
15 -
 16
16 -
 17
17 -
 18
18 -
 19
19 -
 20
20 -
 21
21 -
 22
22 -
23
-
24
 |
 |

0
500
1,000
1,500
2,000
2,500
3,000
3,500
4,000
(Millions of yen)
(Millions of yen)
’07 ’08 ’09 ’10
’07 ’08 ’09
-1600
-1500
-1000
-400
-300
-200
-100
0
’10
’07 ’08 ’09 ’10 ’11
’11
(For the year’s ended March 31) (For the year’s ended March 31)
(For the year’s ended March 31)
(For the year’s ended March 31)
Cash f lows from operating activities
Cash f lows from investing activities
(Millions of yen)
-3,000
-2,000
-1,000
0
1,000
2,000
3,000
4,000
Cash f lows from f inancing activities
-2,676
-1,199
-1,229
-511
-1,174
-1,470
’11
-805
-323
-1,539
1,179
1,478
3,606
3,758
3,461
0
1,000
2,000
Cash Dividends per Share / Payout Raito
’07 ’09 ’10 ’11’08
Cash Dividends per share(yen)
Pay out Raito(%)
22
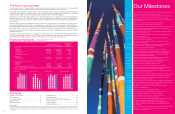
Our financial position
Total assets decreased by ¥1.06bn to ¥27.14bn compared
to the end of the previous fiscal year. The main reason was
a ¥1.90bn decrease in cash and cash equivalents by a
payment of shareholders’ dividends and income tax as
well as the reduction of cash and deposits converted by
the appreciation of the Japanese yen, despite a ¥0.78bn
increase in inventories.
Total liabilities decreased by ¥1.32bn to ¥8.61bn
compared to the end of the previous fiscal year. The main
reasons were a ¥0.99bn decrease in notes and accounts
payable due to the decrease in the purchase of materials
and a ¥0.59bn decrease in accrued income tax, despite a
¥1.97bn increase in provision for Loss on disaster.
Total net assets increased by ¥0.25bn to ¥18.52bn
compared to the end of the previous fiscal year. The main
reason for the increase was a ¥1.99bn increase in retained
earnings, despite a ¥1.21bn payment of shareholders’
dividends and a ¥0.56bn change in foreign currency trans-
lation adjustments due to the appreciation of the Japanese
yen.
Consolidated cash & cash equivalents decreased by
¥1.90bn (+¥1.34bn in the previous fiscal year) to ¥10.45bn
compared to the end of the previous fiscal year.
(Cash Flow from Operating Activities)
Earned operating cash flow was ¥1.18bn (¥3.61bn gained
the previous fiscal year).
The main reason was a ¥2.98bn of NPBT, despite a
payment of income tax of ¥1.34bn.
(Cash Flow from Investing Activities)
Investing cash flow was ¥1.47bn. (¥0.81bn expended in the
previous fiscal year) The main reasons were the purchases
of molds and IT system of ¥1.19bn in fixed assets and a
payment of ¥0.29bn for business acquisition.
(Cash Flow from Financing Activities)
Financing cash flow was ¥1.20bn. (¥1.20bn expended in
the previous fiscal year) The reason was a payment of
shareholders’ dividends.
60.7
3,000
60
50
40
30
20
10
21.8
1,500
29.9
48.3
2,500
3,000
61.2
3,000
3,000
-1,202
(For the year’s ended March 31)
(For the year’s ended March 31)
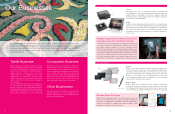
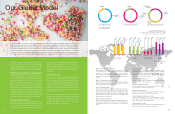
Overview of Business Performance
Wacom Co., Ltd. and Its Subsidiaries
Our results by business sector
’11 26,510
26,679
’10
(Millions of yen)
(Millions of yen)
Sales
Operating
income
Tablet Business
DOWN 0.6%
DOWN 2.6%
5,662
5,812
’11
’10
Operating
income
Operating
income
△236
△617
’11
’10
2011
¥33,075
Sales Breakdown by Business
4,901
6,117
’10
’11
(Millions of yen)
(Millions of yen)
Sales
Component Business
UP 24.8%
1.4%
Tablet Business %
2010
¥32,045
Component Business 18.5%
Other Business 1.4%
Component Business 15.3%
Tablet Business 80.1
83.3
%
21
Tablet business
Tablet business sales maintained nearly the same level as
the previous fiscal year despite its steady sales figures for
each region in local currencies, mainly due to the sub-
stantial appreciation of the Japanese yen. For the Profes-
sional Tablet, “Intuos 4” decreased in sales compared to
the previous fiscal year, due to the struggle in the U.S.
economy and despite the expansion of demand in devel-
oping regions, China and India. Regarding the Consumer
Tablet, “Bamboo” series remained the same sales level
as the previous fiscal year owing to favorable business in
the U.S. and Asia-Oceania areas. For the LCD tablet,
"Cintiq 21UX" for the professional graphics market con-
tinues to receive a strong industry reputation but is
unable to keep pace with orders due to the tight supplies
of high definition LCD panels. As a result, LCD Tablets
carried a backlog of orders globally. Geographically, in
the U.S., sales of the signature tablet for the security field
showed growth. In EU, the sales were significantly influ-
enced by the Euro’ s depreciation, despite steady sales
based on local currency. In Japan, sales decreased due
to the concentrated demand for specific products such
as TVs which are available in the eco-point system for
home electronics in retailers. In Asia and Oceania, sales
grew favorably, especially in China and Korea as well as
India, in a rapid expansion market. As a result, the Tablet
business sales ended at ¥26.51bn (-0.6% YoY), and oper-
ating profit was ¥5.66bn (-2.6% YoY).
Component business
Regarding Wacom Components, sales for PCs incorpo-
rating pen and multi-touch sensor components recorded
significant growth compared to the previous fiscal year
and shipments of pen sensor components to Tablet-type
devices and e-Books based on the Android OS
expanded, however its scale was not enough to improve
profitability. As a result, the component business sales
ended at ¥6.12bn (+24.8% YoY) and operating loss was
¥0.24mn (operating loss ¥0.62 FY09).
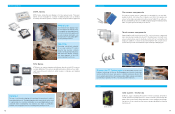
Other businesses
Other businesses so far consist of the CAD software and
the DJ Device. CAD software showed favorable growth
owing to a recovery of manufacturers’ investments in
plant and equipment. In September by launching a new
product “ECAD dio 2011” which enhanced the advanced
wire harness design capability, the business began to
appeal in the mechatronics market. For the DJ device,
although the professional DJ device “Nextbeat” has
received high acclaims and reputation from professional
DJ artists, the market penetration did not advance well
and sales struggled. As a result, other businesses sales
ended at ¥0.45bn (-3.7% YoY), and operating loss was
¥0.15bn (operating loss ¥0.42 in the previous fiscal year).
465
’10
448
’11
Sales
Other Business
DOWN 3.7%
△424
’10
△150
’11
Other Business