Wacom 2011 Annual Report Download - page 11
Download and view the complete annual report
Please find page 11 of the 2011 Wacom annual report below. You can navigate through the pages in the report by either clicking on the pages listed below, or by using the keyword search tool below to find specific information within the annual report.-
 1
1 -
 2
2 -
 3
3 -
 4
4 -
 5
5 -
 6
6 -
 7
7 -
 8
8 -
 9
9 -
 10
10 -
 11
11 -
 12
12 -
 13
13 -
 14
14 -
 15
15 -
 16
16 -
 17
17 -
 18
18 -
 19
19 -
 20
20 -
 21
21 -
 22
22 -
23
-
24
 |
 |

0
2,000
4,000
6,000
8,000
10,000
0
5
10
15
20
25
30
40
50
60
70
80
(Millions of yen)
(%)
(%)
’07 ’08 ’09 ’10 ’11
’08 ’08 ’09 ’10 ’11
’07 ’08 ’09 ’10 ’11
(For the year’s ended March 31)
(For the year’s ended March 31)
(For the year’s ended March 31)
Overview of Business Performance
How did the global economy affect
our business in our 28th year?
(ROE)
(ROA)
Note: Common shares were split on a four-for-one basis on November
18,2005. Per share data before 2005.3.F.Y.term reflect the above
share splits.
Wacom Co., Ltd. and Its Subsidiaries
Net income per share (basic)
ROE/ROA
Equity ratio
4,944
6,886
8,349
6,214
4,900
10.8
7.2
19.3
20.1
12.4 12.9
14.2
10.9
7.3
9.4
68.1
64.9 63.5
69.4
64.8
Note 1: ROA equals net income/average total assets.
Note 2: During its 23rd fiscal year, the Group procured through a
public offering approximately 4.2 billion yen in capital funds
by allocating new shares to a third party.
20
Our business environment for the fiscal year ended March 31, 2011
didn’t attain full-scale recovery despite signs of improvement in the
global economy. The rekindled credit crunch in EU and a rise in
crude oil prices dampened the recovery of consumer spending,
besides continuous economic growth in emerging markets and the
improvement of business confidence owing to a monetary policy in
the U.S. In addition, the Great East Japan earthquake severely
damaged eastern parts of Japan, and left Japan with a future of
uncertainty and rapid domestic economic slowdown. In the foreign
exchange market, the substantial appreciation of the Japanese yen
developed against the major currencies. In the IT field, smart
phones and Tablet-type devices are growing rapidly as new IT
platforms.
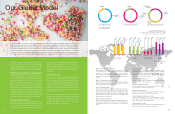
Turning to our product markets in the field of professional graphics,
the graphics industry continues to expand rapidly in emerging
markets such as China and India. The productivity improvement in
digital processing became further focused on, owing to the growing
trend to produce 3D films and the expansion of the digital animation
industry in Asian regions. As for consumer products, customers for
hobby use are increasing in all regions. In the health, education, and
financial fields, the use of LCD tablets has increased with the
demand for more paperless and secure processes. Moreover, in the
component fields, as well as existing Tablet PC markets for
Windows OS, Tablet-type devices and e-Books running on Android
OS are raising new demand for pen and touch technologies.
Under the conditions described above, Wacom strived for an
increase in sales through aggressive marketing activities in each
business, through cost management and through the expansion of
new fields. As a result, both sales and profits had marked growth
compared to the previous fiscal year. For the Tablet business, it
aimed to expand the demand for replacement upgrades and to
attract new users of professional products through marketing
campaigns. It also began offering free downloads of applications
for consumer tablets and won international awards in U.S. and EU.
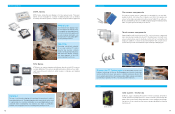
To meet the needs of advanced paperless security requirements,
the Tablet business added a new color LCD model to the signature
tablet. In addition, Wacom acquired the software business for
digital signature certification of “Florentis Ltd.” in the UK to enhance
the capability to provide advanced solutions in this field. For the
Component business, it not only strived to expand the business on
Tablet-type devices and e-Book category devices but also contin-
ued to strengthen production of its multi-touch sensor system. In
terms of capital expenditure, Wacom continued to develop its
global IT infrastructure which helps increase productivity and
support future growth. The company smoothly cut over a new
global SCM system in April, 2010 and also continues to improve its
ERP system. On the other side, the restoration expense of our
factory building headquarters in Saitama pref. affected by the Great
East Japan Earthquake on March 2011 and the business liquidation
loss of the professional DJ device, ”Nextbeat” were booked as
extraordinary losses.
As a result, the consolidated business results ended in sales of
¥33.08bn (+3.2% YoY), operating income of ¥3.28bn (+5.0% YoY),
ordinary income of ¥3.40bn (+7.6% YoY), and net income of
¥1.99bn (+0.9% YoY).
15,667
’07 ’08 ’09 ’10
(Millions of yen)
0
5,000
10,000
15,000
20,000
25,000
35,000
40,000
30,000
’11 ’07 ’08 ’09 ’10 ’11 ’07 ’08 ’09 ’10
(Millions of yen) (%) (Millions of yen) (%)
0
5,000
10,000
15,000
20,000
35
40
45
50
55
0
1,000
2,000
3,000
4,000
6,000
5,000
0
5
10
15
20
30
25
’11
(For the year’s ended March 31) (For the year’s ended March 31) (For the year’s ended March 31)
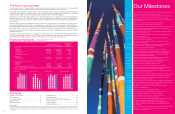
Five-Year Summary
Net sales
Operating income/Operating margin
Gross profit/Gross profit margin
For the year:
Net sales
Gross profit
Operating income
Income before income taxes
Net income
Comprehensive income
At year end:
Cash and cash equivalents
Total net assets
Total assets
Net income per share
(yen and U.S. dollars):**
Basic
Diluted
Equity ratio(%)***
Return on equity (%)
Number of employees
$397,777
188,414
39,498
35,895
23,891
17,168
125,734
326,339
222,772
$59.46
$59.28
Five-Year Summary
Wacom Co., Ltd. and Its Subsidiaries
33,075
28,787
36,739
33,809
32,045
9.9
3,284
19
47.4
16,761
15,668
15,028
18,640
50.7
52.2
49.6 48.9
*Note 1: U.S. dollar amounts have been translated from yen, for convenience only, at the rate of ¥83.15=U.S.$1, the approximate exchange rate prevailing on March 31, 2011
**Note 2: 20,000 shares were repurchesed as treasury stock for 1.85BJPY in 2009.3 F.Y..
Thousands of
U.S. dollars*
Year ended
March 31
2011
¥36,739,196
18,640,355
5,538,871
5,564,082
3,501,360
-
13,577,194
18,516,742
29,221,330
8,348.74
8,304.38
63.5
20.1
584
¥33,809,138
16,761,164
4,311,378
4,179,661
2,579,025
-
11,014,114
17,796,487
25,631,057
¥6,213.93
¥6,197.78
69.4
14.2
637
¥32,044,578
15,668,147
3,127,822
3,120,867
1,968,406
-
12,350,113
18,269,590
28,199,429
¥4,899.57
¥4,888.56
64.8
10.9
702
¥33,075,177
15,666,644
3,284,285
2,984,707
1,986,502
1,427,472
¥10,454,820
27,135,088
18,523,531
¥4,943.81
¥4,928.81
68.1
10.8
747
¥28,787,066
15,027,641
4,564,593
4,738,219
2,853,274
-
12,707,153
16,320,081
25,152,191
6,886.19
6,784.24
64.9
19.3
511
Thousands of yen
Year ended March 31
2007 2010 201120092008
4,311
4,565
15.9
5,539
15.1
12.8
9.8
3,128