Vtech 2012 Annual Report Download - page 9
Download and view the complete annual report
Please find page 9 of the 2012 Vtech annual report below. You can navigate through the pages in the report by either clicking on the pages listed below, or by using the keyword search tool below to find specific information within the annual report.-
 1
1 -
 2
2 -
 3
3 -
 4
4 -
 5
5 -
 6
6 -
 7
7 -
 8
8 -
 9
9 -
 10
10 -
 11
11 -
 12
12 -
 13
13 -
 14
14 -
 15
15 -
 16
16 -
 17
17 -
 18
18 -
 19
19 -
 20
20 -
21
-
22
-
23
-
24
-
25
-
26
-
27
-
28
-
29
-
30
-
31
-
32
-
33
-
34
-
35
-
36
-
37
-
38
-
39
-
40
-
41
-
42
-
43
-
44
-
45
-
46
-
47
-
48
-
49
-
50
-
51
-
52
-
53
-
54
-
55
-
56
-
57
-
58
-
59
-
60
-
61
-
62
-
63
-
64
-
65
-
66
-
67
-
68
-
69
-
70
-
71
-
72
 |
 |

7
VTech Holdings Ltd Annual Report 2012
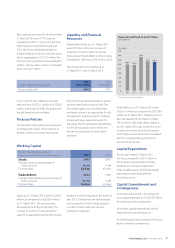
Deposits and Cash in Last 5 Years
(As at 31 March)
450
400
350
300
250
200
150
100
50
0
US$ million
08 09 10 11 12
300.1*
* Include currency-linked deposits
292.1*
382.6
333.1 326.5
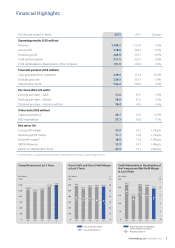
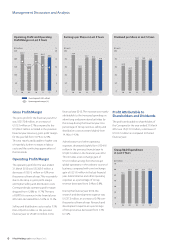
Basic earnings per share for the year ended
31 March 2012 were US77.0 cents as
compared to US81.5 cents in the previous
financial year. During the financial year
2012, the Group declared and paid an
interim dividend of US16.0 cents per share,
which aggregated to US$39.9 million. The
Directors have proposed a final dividend of
US60.0 cents per share, which is estimated
to be US$149.7 million.
As at 31 March 2012 and 2011
2012
US$ million
2011
US$ million
Deposits and cash 326.5 333.1
As at 31 March 2012, deposits and cash
reduced from US$333.1 million to US$326.5
million, a decrease of 2.0% compared with
the last financial year-end-date.
Treasury Policies
The Group’s treasury policies are designed
to mitigate the impact of fluctuations in
foreign currency exchange rates arising
Liquidity and Financial
Resources
Shareholders’ funds as at 31 March 2012
were US$556.2 million, an increase of
2.3% from US$543.9 million in the last
financial year. Shareholders’ funds per share
increased by 1.8% from US$2.19 to US$2.23.
The Group had no borrowings as at
31 March 2011 and 31 March 2012.
from the Group’s global operations and to
minimise the Group’s financial risks. The
Group principally uses forward foreign
exchange contracts as appropriate for risk
management purposes only, for hedging
foreign exchange transactions and for
managing the Group’s assets and liabilities.
It is the Group’s policy not to enter into
derivative transactions for speculative
purposes.
Working Capital
As at 31 March 2012 and 2011
All figures are in US$ million unless stated otherwise 2012 2011
Stocks 239.2 229.8
Average stocks as a percentage of
Group revenue
13.1%
11.4%
Turnover days 82 days 85 days
Trade debtors 210.6 198.8
Average trade debtors as a percentage of
Group revenue 11.5% 11.2%
Turnover days 56 days 63 days
Stocks as of 31 March 2012 were US$239.2
million, as compared to US$229.8 million
on 31 March 2011. The turnover days
decreased from 85 days to 82 days. The
increase in stock level was primarily to
cater for increased demand for the Group’s
products in the first quarter of the financial
year 2013. Furthermore, we had arranged
early production of the Group’s products
in order to better utilise the Group’s
production capacities.
Trade debtors as of 31 March 2012 were
US$210.6 million as compared to US$198.8
million on 31 March 2011. Debtor turnover
days decreased from 63 days to 56 days.
The increase in the trade debtor balance
as at 31 March 2012 was mainly due to an
increase in revenue in the fourth quarter
of the financial year 2012 when compared
with the corresponding period of the
previous financial year.
Capital Expenditure
For the year ended 31 March 2012,
the Group invested US$29.7 million in
the purchase of plant and machinery,
equipment, computer systems and
other tangible assets. All of these capital
expenditures were financed from
internal resources.
Capital Commitments and
Contingencies
In the financial year 2013, the Group will
incur capital expenditure of US$32.9 million
for ongoing business operations.
All of these capital expenditures will be
financed from internal resources.
As of the financial year end date, the Group
had no material contingencies.