Vtech 2012 Annual Report Download - page 7
Download and view the complete annual report
Please find page 7 of the 2012 Vtech annual report below. You can navigate through the pages in the report by either clicking on the pages listed below, or by using the keyword search tool below to find specific information within the annual report.-
 1
1 -
 2
2 -
 3
3 -
 4
4 -
 5
5 -
 6
6 -
 7
7 -
 8
8 -
 9
9 -
 10
10 -
 11
11 -
 12
12 -
 13
13 -
 14
14 -
 15
15 -
 16
16 -
 17
17 -
 18
18 -
19
-
20
-
21
-
22
-
23
-
24
-
25
-
26
-
27
-
28
-
29
-
30
-
31
-
32
-
33
-
34
-
35
-
36
-
37
-
38
-
39
-
40
-
41
-
42
-
43
-
44
-
45
-
46
-
47
-
48
-
49
-
50
-
51
-
52
-
53
-
54
-
55
-
56
-
57
-
58
-
59
-
60
-
61
-
62
-
63
-
64
-
65
-
66
-
67
-
68
-
69
-
70
-
71
-
72
 |
 |

5
VTech Holdings Ltd Annual Report 2012
Management Discussion and Analysis
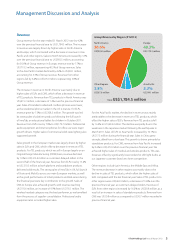
Group Revenue by Region (FY2012)
North America
50.6%
US$903.5 million
Europe
40.3%
US$719.3 million
Other Regions
3.8%
US$67.6 million
Asia Pacific
5.3%
US$94.1 million
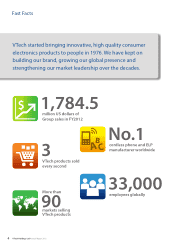
Revenue
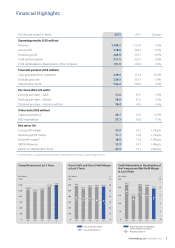
Group revenue for the year ended 31 March 2012 rose by 4.2%
over the previous financial year to US$1,784.5 million. The increase
in revenue was largely driven by higher sales in North America
and Europe, which contrasted with a decrease in revenue in Asia
Pacific and other regions. Sales to North America increased by 3.3%
over the previous financial year to US$903.5 million, accounting
for 50.6% of Group revenue. In Europe, revenue rose by 7.7% to
US$719.3 million, representing 40.3% of Group revenue. Sales
to the Asia Pacific market declined by 4.2% to US$94.1 million,
accounting for 5.3% of Group revenue. Revenue from other
regions fell by 6.2% to US$67.6 million, representing 3.8% of
Group revenue.
The increase in revenue in North America was mainly due to
higher sales of ELPs and CMS, which offset a decrease in revenue
of TEL products. Revenue from TEL products in North America was
US$415.3 million, a decrease of 1.4% over the previous financial
year. Sales of branded corded and cordless phones were lower,
as the residential phone market in the US is mature. For ELPs,
revenue grew by 7.5% to US$308.5 million. The growth was led
by strong sales of platform products following the full launch
of InnoTab, an educational tablet for children in October 2011.
Revenue from CMS rose by 7.8% to US$179.7 million. Professional
audio equipment and internet phones for office use were major
growth drivers. Higher sales of commercial solid-state lighting also
supported growth.
Sales growth in the European market was largely driven by higher
sales in ELPs and CMS, which offset a decrease in revenue of TEL
products. For TEL products, which we sell in Europe largely on an
Original Design Manufacturing (ODM) basis, revenue declined
by 1.0% to US$215.4 million as customers delayed orders in the
second half of the financial year. Revenue from ELPs rose by 13.2%
to US$310.3 million as both platform and standalone products
delivered solid results. The strong sales of InnoTab in UK, full launch
of Storio and MobiGo across our main European markets, as well
as the good performance of infant products and Kidi-series during
the financial year were key contributors to the growth. Sales of
CMS to Europe also achieved growth, with revenue reaching
US$193.6 million, an increase of 9.9% from US$176.1 million. The
wireless headset category was the best performer, as we benefited
from the process of supplier consolidation. Professional audio
equipment also recorded higher sales.
For the Asia Pacific market, the decline in revenue was mainly
attributable to the decrease in revenue of TEL products, which
offset the higher sales of ELPs. Revenue from TEL products fell
by 16.4% to US$29.6 million. The decline was partly due to the
weakness in the Japanese market following the earthquake in
March 2011. Sales of ELPs to Asia Pacific increased by 10.1% to
US$17.5 million during the financial year. Sales in China grew
strongly, albeit from a low base. This growth is driven primarily by
standalone products. For CMS, revenue from Asia Pacific increased
by 0.2% to US$47.0 million over the previous financial year. We
achieved higher sales of medical and wireless products. This was,
however, offset by significantly lower orders for LED light bulbs, as
our Japanese customer faced very keen competition.
Other regions include Latin America, the Middle East and Africa.
The revenue decrease in other regions was mainly due to the
decline in sales of TEL products, which offset the higher sales of
ELPs compared with the last financial year. Sales of TEL products to
other regions were US$46.0 million, a decrease of 14.0% over the
previous financial year as customers delayed orders. Revenue of
ELPs from other regions increased by 16.2% to US$20.8 million, as a
result of an increase in sales of standalone products. Revenue from
CMS was US$0.8 million as compared to US$0.7 million recorded in
previous financial year.
Total: US$1,784.5 million