Vtech 2008 Annual Report Download - page 7
Download and view the complete annual report
Please find page 7 of the 2008 Vtech annual report below. You can navigate through the pages in the report by either clicking on the pages listed below, or by using the keyword search tool below to find specific information within the annual report.-
 1
1 -
 2
2 -
 3
3 -
 4
4 -
 5
5 -
 6
6 -
 7
7 -
 8
8 -
 9
9 -
 10
10 -
 11
11 -
 12
12 -
 13
13 -
 14
14 -
 15
15 -
 16
16 -
 17
17 -
 18
18 -
19
-
20
-
21
-
22
-
23
-
24
-
25
-
26
-
27
-
28
-
29
-
30
-
31
-
32
-
33
-
34
-
35
-
36
-
37
-
38
-
39
-
40
-
41
-
42
-
43
-
44
-
45
-
46
-
47
-
48
-
49
-
50
-
51
-
52
-
53
-
54
-
55
-
56
-
57
-
58
-
59
-
60
 |
 |

VTech Holdings Ltd Annual Report 2008 5
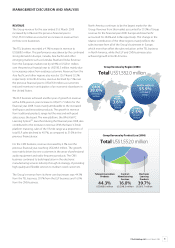
North America continues to be the largest market for the
Group. Revenue from this market accounted for 55.9% of Group
revenue for the nancial year 2008. Europe and Asia Paci c
accounted for 38.0% and 3.6% respectively. This change in the
relative contribution of the three regions mainly re ects the
sales increase from all of the Group’s businesses in Europe,
which more than o set the sales reduction at the TEL business
in North America, while the ELP and CMS businesses also
achieved growth in North America.
Group Revenue by Region (2008)
Total US$1,552.0 million
EUROPE
38.0%
US$590.0
million ASIA
PACIFIC
3.6%
US$56.1
million OTHERS
2.5%
US$37.7
million
NORTH AMERICA
55.9%
US$868.2
million
MANAGEMENT DISCUSSION AND ANALYSIS
REVENUE
The Group revenue for the year ended 31st March 2008
increased by 6.0% over the previous nancial year to
US$1,552.0 million as a result of an increase in revenue from
its three core businesses.
The TEL business recorded a 4.1% increase in revenue to
US$688.0 million. This performance was driven by the continued
strong demand in Europe, Canada, Asia Paci c and other
emerging markets such as Australia, Brazil and India. Revenue
from the European market rose by 42.9% or US$54.1 million
over the previous nancial year to US$180.3 million mainly due
to increasing orders from existing customers. Revenue from the
Asia Paci c and other regions also rose by 126.1% and 32.3%
respectively. In North America, revenue declined by 7.3% over
the previous nancial year to US$476.8 million as customers
reduced inventory in anticipation of an economic slowdown in
the United States.
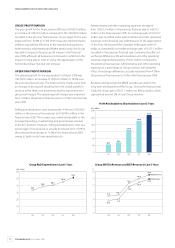
The ELP business achieved another year of growth in revenue
with a 8.0% year-on-year increase to US$615.7 million for the
nancial year 2008. It was mainly attributable to the increased
shelf space and innovative products. The growth in revenue
from traditional products range led the way and with good
sales across the board. The new platform, the Whiz Kid PC
Learning SystemTM, launched during the nancial year 2008, also
contributed to the increase in revenue. With the basic V.Smile
platform maturing, sales of the V.Smile range as a proportion of
total ELP sales declined to 40.7%, as compared to 51.0% in the
previous nancial year.
For the CMS business, revenue increased by 6.5% over the
previous nancial year, reaching US$248.3 million. The growth
was mainly driven by new customers in the areas of professional
audio equipment and radio frequency products. The CMS
business continued to build reputation in the electronic
manufacturing services industry through its strategy of providing
high quality and exible services to medium sized customers.
The Group’s revenue from its three core businesses was: 44.3%
from the TEL business, 39.7% from the ELP business and 16.0%
from the CMS business.
Group Revenue by Product Line (2008)
Total US$1,552.0 million
Electronic
Learning
Products
39.7%
US$615.7 million
Contract
Manufacturing
Services
16.0%
US$248.3 million
Telecommunication
Products
44.3%
US$688.0 million