Vtech 2008 Annual Report Download - page 15
Download and view the complete annual report
Please find page 15 of the 2008 Vtech annual report below. You can navigate through the pages in the report by either clicking on the pages listed below, or by using the keyword search tool below to find specific information within the annual report.-
 1
1 -
2
-
3
-
4
-
 5
5 -
 6
6 -
 7
7 -
 8
8 -
 9
9 -
 10
10 -
 11
11 -
 12
12 -
 13
13 -
 14
14 -
 15
15 -
 16
16 -
 17
17 -
 18
18 -
 19
19 -
 20
20 -
 21
21 -
 22
22 -
 23
23 -
 24
24 -
 25
25 -
26
-
27
-
28
-
29
-
30
-
31
-
32
-
33
-
34
-
35
-
36
-
37
-
38
-
39
-
40
-
41
-
42
-
43
-
44
-
45
-
46
-
47
-
48
-
49
-
50
-
51
-
52
-
53
-
54
-
55
-
56
-
57
-
58
-
59
-
60
 |
 |

VTech Holdings Ltd Annual Report 2008 13
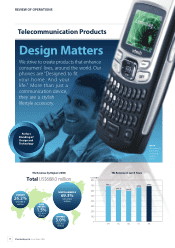
The CMS business achieved a fourth consecutive record
performance, with revenue for the nancial year 2008 increasing
by 6.5% over the nancial year 2007 to US$248.3 million. The
business accounted for 16.0% of Group revenue, against 15.9%
in the previous nancial year. The growth was mainly driven by
new customers in the areas of professional audio equipment
and radio frequency products.
With a strong commitment to providing high quality and
exible services to medium sized customers, we continued to
build our reputation in the Electronic Manufacturing Services
industry and are increasingly winning business through word-
of-mouth recommendation. This is especially true in the eld
of professional audio equipment, which as a result became the
largest product category of the CMS business in the nancial year
2008, accounting for 26.8% of total CMS revenue. This category
was followed by switching mode power supplies at 25.4%, home
appliances at 13.0% and wireless products at 13.0%.
Geographically, North America showed greater momentum
than Europe, raising its share of total CMS revenue from 36.6%
in the previous nancial year to 40.4% in the nancial year
2008. Europe remained the largest market of the CMS business,
accounting for 45.7% of total CMS revenue, followed by Asia
Paci c at 13.9%. During the nancial year 2008, the business
made good progress in developing Japanese customers, who
have been impressed by our new dedicated facility.
Despite continued cost pressures, the CMS business has been
able to mitigate the impact of cost increases through economies
of scale and leveraging the procurement power of the Group.
We were also able to pass on some cost increases to customers.
In the middle of the calendar year 2007, the business initiated a
six sigma project in order to achieve further cost improvements.
The quality of the service we o er was again evidenced by a
number of supplier awards. These included one in recognition
of outstanding collaboration and execution in manufacturing
from a customer in the eld of wireless products, and one
acknowledging that we had met the highest supplier standards
for a customer in the eld of solid-state lighting system.
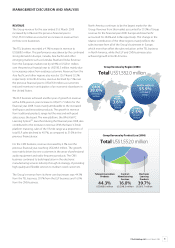
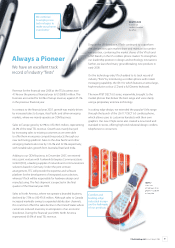
CMS Revenue by Region (2008)
Total US$248.3 million
EUROPE
45.7%
US$113.6
million ASIA
PACIFIC
13.9%
US$34.4
million
NORTH AMERICA
40.4%
US$100.3
million
CMS Revenue by Product Line (2008)
Total US$248.3 million
Others
21.8%
US$54.4 million
Home
Appliances
13.0%
US$32.3 million
Wireless
Products
13.0%
US$32.2 million
Professional
Audio Equipment
26.8%
US$66.5 million
Switching Mode
Power Supplies
25.4%
US$62.9 million
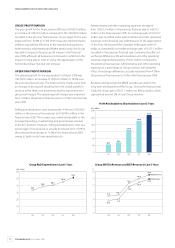
CMS Revenue in Last 5 Years