Vtech 2007 Annual Report Download - page 9
Download and view the complete annual report
Please find page 9 of the 2007 Vtech annual report below. You can navigate through the pages in the report by either clicking on the pages listed below, or by using the keyword search tool below to find specific information within the annual report.-
 1
1 -
 2
2 -
 3
3 -
 4
4 -
 5
5 -
 6
6 -
 7
7 -
 8
8 -
 9
9 -
 10
10 -
 11
11 -
 12
12 -
 13
13 -
 14
14 -
 15
15 -
 16
16 -
 17
17 -
 18
18 -
 19
19 -
 20
20 -
21
-
22
-
23
-
24
-
25
-
26
-
27
-
28
-
29
-
30
-
31
-
32
-
33
-
34
-
35
-
36
-
37
-
38
-
39
-
40
-
41
-
42
-
43
-
44
-
45
-
46
-
47
-
48
-
49
-
50
-
51
-
52
-
53
-
54
-
55
-
56
-
57
-
58
-
59
-
60
 |
 |

VTech Holdings Ltd
Annual Report 2007 7
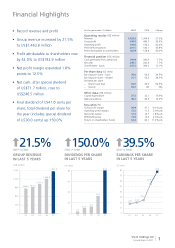
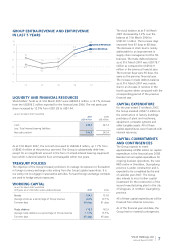
GROUP EBITDA/REVENUE AND EBIT/REVENUE
IN LAST 5 YEARS
03
6.9
9.7
04
5.4
7.4
05
6.1
7.9
06
12.9
11.3
07
14.9
13.3
%
EBITDA/REVENUE
EBIT/REVENUE
0
3
9
12
6
15
LIQUIDITY AND FINANCIAL RESOURCES
Shareholders’ funds as at 31st March 2007 were US$343.3 million, a 12.1% increase
from the US$306.2 million reported for the fi nancial year 2006. The net assets per
share increased by 12.5% from US$1.28 to US$1.44.
As at 31st March 2007 and 2006
2007 2006
US$ million US$ million
Cash 246.5 242.4
Less: Total interest bearing liabilities – –
Net cash position 246.5 242.4
As at 31st March 2007, the net cash increased to US$246.5 million, up 1.7% from
US$242.4 million at the previous year-end. The Group is substantively debt-free,
except for an insignifi cant amount in the form of a fi xed-interest bearing equipment
loan which is denominated in Euro and repayable within two years.
TREASURY POLICIES
The objective of the Group’s treasury policies is to manage its exposure to fl uctuation
in foreign currency exchange rates arising from the Group’s global operations. It is
our policy not to engage in speculative activities. Forward foreign exchange contracts
are used to hedge certain exposures.
WORKING CAPITAL
As at 31st March 2007 and 2006
All fi gures are in US$ million unless stated otherwise 2007 2006
Stocks 124.1 133.8
Average stocks as a percentage of Group revenue 8.8% 10.7%
Turnover days 68 days 81 days
Trade debtors 178.7 162.9
Average trade debtors as a percentage of Group revenue 11.7% 13.5%
Turnover days 65 days 65 days
The stock balance as at 31st March
2007 decreased by 7.2% over the
balance at 31st March 2006 to
US$124.1 million. The turnover days
improved from 81 days to 68 days.
The decrease in stock level is mainly
attributable to an improvement in
supply chain management at the TEL
business. The trade debtors balance
as at 31st March 2007 was US$178.7
million as compared to US$162.9
million in the previous fi nancial year.
The turnover days were 65 days, the
same as the previous fi nancial year.
The increase in trade debtors balance
as at 31st March 2007 was mainly
due to an increase in revenue in the
fourth quarter when compared with the
corresponding period of the previous
fi nancial year.
CAPITAL EXPENDITURE
For the year ended 31st March 2007,
the Group invested US$37.2 million in
the construction of factory buildings,
purchases of plant and machinery,
equipment, computer systems and
other tangible assets. All of these
capital expenditures were fi nanced with
internal resources.
CAPITAL COMMITMENTS
AND CONTINGENCIES
The Group expects to invest
approximately US$59 million on capital
expenditure in the fi nancial year 2008.
Besides normal capital expenditure for
ongoing business operations, the new
R&D centre in Shenzhen, Guangdong
province is under construction and is
expected to be completed by the end
of calendar year 2007. The Group
also intends to incur further capital
investment for the construction of the
second manufacturing plant in the city
of Qingyuan, in northern Guangdong
province.
All of these capital expenditures will be
fi nanced from internal resources.
As of the fi nancial year end date, the
Group had no material contingencies.
04VtechMD&A(E).indd7 2007/7/511:43:08PM