Vtech 2007 Annual Report Download - page 8
Download and view the complete annual report
Please find page 8 of the 2007 Vtech annual report below. You can navigate through the pages in the report by either clicking on the pages listed below, or by using the keyword search tool below to find specific information within the annual report.
VTech Holdings Ltd
Annual Report 2007
6
OPERATING
PROFIT/MARGIN
The operating profi t for the year
ended 31st March 2007 was US$194.0
million, an increase of US$57.8 million
or 42.4% over the previous fi nancial
year. The improvement mainly came
from a signifi cant increase in gross
profi t resulting from the overall growth
in revenue at the three core businesses.
The operating profi t margin also
improved from 11.3% in the previous
fi nancial year to 13.3% in the fi nancial
year 2007. A signifi cant part of the
improvement was attributable to the
rebound at the TEL business whose
contribution to the Group continued to
improve in the fi nancial year 2007.
Selling and distribution costs increased
by 14.1% from US$209.2 million
in the previous fi nancial year to
US$238.6 million in the fi nancial year
2007. The increase was mainly due
to higher spending on advertising
and promotional activities at the
ELP business. Royalty payments to
licensors for the use of popular cartoon
characters for certain ELPs and V.Smile
Smartridges also increased, which was
in line with increased sales of the
V.Smile product range. However, selling
and distribution costs as a percentage
of Group revenue actually decreased
from 17.4% in the previous fi nancial
year to 16.3% in the fi nancial year
2007, owing to management’s success
in maintaining a tight control over
operating costs.
Administrative and other operating
expenses increased from US$61.0
million in the previous fi nancial year
to US$62.2 million in the fi nancial
year 2007. An exchange gain of
US$3.1 million was recorded under
administrative and other operating
expenses in the current fi nancial year
because of the appreciation of the
Euro and Sterling against the US dollar.
This contrasted with an exchange
loss of US$2.6 million recorded in the
previous fi nancial year. Excluding the
effect of exchange differences, the
administrative and other operating expenses increased by US$6.9 million compared
to the previous fi nancial year, partly due to an increase in employee related costs
as business has expanded. The administrative and other operating expenses as
percentage of Group revenue, excluding the effect of exchange differences, actually
improved from 4.8% in the previous fi nancial year to 4.5% in the fi nancial year
2007.
Research and development (R&D) activities are vital for the long-term development of
the Group. During the fi nancial year 2007, the Group spent US$45.2 million on R&D
activities, which represented around 3% of total Group revenue.
GROUP R&D EXPENDITURE IN LAST 5 YEARS
03
31.0
04
33.2
05
38.5
06
40.3
07
45.2
US$ million
0
10
20
30
40
50
NET PROFIT AND
DIVIDENDS
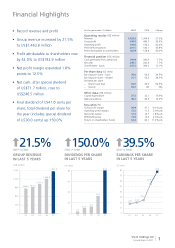
The profi t attributable to shareholders
for the year ended 31st March 2007
was US$182.9 million, an increase
of US$54.1 million as compared to
the previous fi nancial year. The ratios
of EBIT and EBITDA to revenue were
13.3% and 14.9% respectively.
Basic earnings per share for the year
ended 31st March 2007 were US76.6
cents as compared to US54.9 cents in
the previous fi nancial year. During the
year, the Group declared and paid an
interim dividend and a special dividend of
US9.0 cents per share and US30.0 cents
per share respectively, which aggregated
to US$93.2 million. The directors have
proposed a fi nal dividend of US41.0
cents per share, which will aggregate to
US$98.0 million. Excluding the special
dividend, the total dividend for the year
amounted to US50.0 cents per share,
representing an increase of US18.0 cents
per share or 56.3% from the previous
fi nancial year.
PROFIT ATTRIBUTABLE
TO SHAREHOLDERS
IN LAST 5 YEARS
US$ million
0
40
80
120
160
200
03
40.8
04
46.3
05
56.9
06
128.8
07
182.9
Management Discussion and Analysis
04VtechMD&A(E).indd6 2007/7/511:43:07PM

