Vtech 2007 Annual Report Download - page 3
Download and view the complete annual report
Please find page 3 of the 2007 Vtech annual report below. You can navigate through the pages in the report by either clicking on the pages listed below, or by using the keyword search tool below to find specific information within the annual report.-
 1
1 -
 2
2 -
 3
3 -
 4
4 -
 5
5 -
 6
6 -
 7
7 -
 8
8 -
 9
9 -
 10
10 -
 11
11 -
 12
12 -
 13
13 -
 14
14 -
15
-
16
-
17
-
18
-
19
-
20
-
21
-
22
-
23
-
24
-
25
-
26
-
27
-
28
-
29
-
30
-
31
-
32
-
33
-
34
-
35
-
36
-
37
-
38
-
39
-
40
-
41
-
42
-
43
-
44
-
45
-
46
-
47
-
48
-
49
-
50
-
51
-
52
-
53
-
54
-
55
-
56
-
57
-
58
-
59
-
60
 |
 |

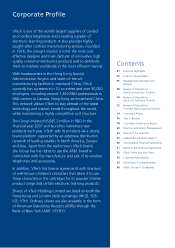
VTech Holdings Ltd
Annual Report 2007 1
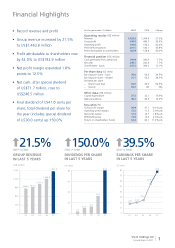
• Record revenue and profi t
• Group revenue increased by 21.5%
to US$1,463.8 million
• Profi t attributable to shareholders rose
by 42.0% to US$182.9 million
• Net profi t margin expanded 1.8%
points to 12.5%
• Net cash, after special dividend
of US$71.7 million, rose to
US$246.5 million
• Final dividend of US41.0 cents per
share, total dividend per share for
the year (includes special dividend
of US30.0 cents) up 150.0%
For the year ended 31st March 2007 2006 Change
Operating results (US$ million)
Revenue 1,463.8 1,204.6 21.5%
Gross profi t 540.0 446.7 20.9%
Operating profi t 194.0 136.2 42.4%
Profi t before taxation 201.5 140.1 43.8%
Profi t attributable to shareholders 182.9 128.8 42.0%
Financial position (US$ million)
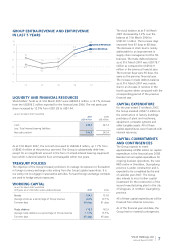
Cash generated from operations 196.9 182.9 7.7%
Net cash 246.5 242.4 1.7%
Shareholders’ funds 343.3 306.2 12.1%
Per share data (US cents)
Earnings per share – basic 76.6 54.9 39.5%
Earnings per share – diluted 75.1 54.3 38.3%
Dividend per share
– Interim and fi nal 50.0 32.0 56.3%
– Special 30.0 Nil N/A
Other data (US$ million)
Capital expenditure 37.2 32.1 15.9%
R&D expenditure 45.2 40.3 12.2%
Key ratios (%)
Gross profi t margin 36.9 37.1 -0.2% pts
Operating profi t margin 13.3 11.3 2.0% pts
Net profi t margin 12.5 10.7 1.8% pts
EBITDA/Revenue 14.9 12.9 2.0% pts
Return on shareholders’ funds 53.3 42.1 11.2% pts
EARNINGS PER SHARE
IN LAST 5 YEARS
GROUP REVENUE
IN LAST 5 YEARS
(2007 vs 2006) (2007 vs 2006) (2007 vs 2006)
DIVIDENDS PER SHARE
IN LAST 5 YEARS
39.5%150.0%21.5%
US cents
US cents
US$ million
80
60
50
30
40
10
20
0
70
03
18.1
04
20.5
05
25.2
06
54.9
07
76.6
0
20
40
60
80
03 04 05 06 07
3.5
10.0 13.0
32.0
80.0
0
300
600
900
1,200
1,500
03 04 05 06 07
866.5 915.2
1,022.0
1,204.6
1,463.8
Financial Highlights
02VtechFinancialHighlights(E)11 2007/7/511:43:42PM