Vodafone 2011 Annual Report Download - page 112
Download and view the complete annual report
Please find page 112 of the 2011 Vodafone annual report below. You can navigate through the pages in the report by either clicking on the pages listed below, or by using the keyword search tool below to find specific information within the annual report.-
 1
1 -
2
-
3
-
4
-
5
-
6
-
7
-
8
-
9
-
10
-
11
-
12
-
13
-
14
-
15
-
16
-
17
-
18
-
19
-
20
-
21
-
22
-
23
-
24
-
25
-
26
-
27
-
28
-
29
-
30
-
31
-
32
-
33
-
34
-
35
-
36
-
37
-
38
-
39
-
40
-
41
-
42
-
43
-
44
-
45
-
46
-
47
-
48
-
49
-
50
-
51
-
52
-
53
-
54
-
55
-
56
-
57
-
58
-
59
-
60
-
61
-
62
-
63
-
64
-
65
-
66
-
67
-
68
-
69
-
70
-
71
-
72
-
73
-
74
-
75
-
76
-
77
-
78
-
79
-
80
-
81
-
82
-
83
-
84
-
85
-
86
-
87
-
88
-
89
-
90
-
91
-
92
-
93
-
94
-
95
-
96
-
97
-
98
-
99
-
100
-
101
-
 102
102 -
 103
103 -
 104
104 -
 105
105 -
 106
106 -
 107
107 -
 108
108 -
 109
109 -
 110
110 -
 111
111 -
 112
112 -
 113
113 -
 114
114 -
 115
115 -
 116
116 -
 117
117 -
 118
118 -
 119
119 -
 120
120 -
 121
121 -
 122
122 -
123
-
124
-
125
-
126
-
127
-
128
-
129
-
130
-
131
-
132
-
133
-
134
-
135
-
136
-
137
-
138
-
139
-
140
-
141
-
142
-
143
-
144
-
145
-
146
-
147
-
148
-
149
-
150
-
151
-
152
-
153
-
154
-
155
-
156
 |
 |

110 Vodafone Group Plc Annual Report 2011
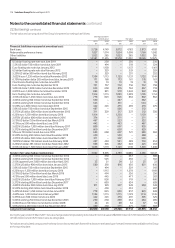
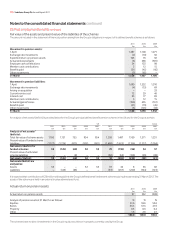
Notes to the consolidated nancial statements continued
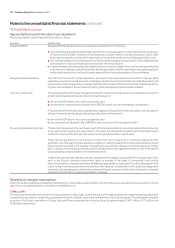
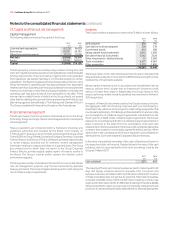
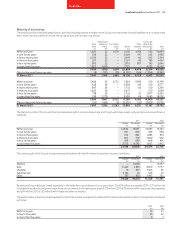
21. Capital and nancial risk management
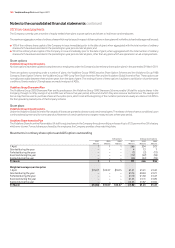
Capital management
The following table summarises the capital of the Group:
2011 2010
£m £m
Cash and cash equivalents (6,252) (4,423)
Borrowings 38,281 39,795
Other financial instruments (2,171) (2,056)
Net debt 29,858 33,316
Equity 87,561 90,810
Capital 117,419 124,126
The Group’s policy is to borrow centrally using a mixture of long-term and
short-term capital market issues and borrowing facilities to meet anticipated
funding requirements. These borrowings, together with cash generated
from operations, are loaned internally or contributed as equity to certain
subsidiaries. The Board has approved three internal debt protection ratios
being: net interest to operating cash flow (plus dividends from associates);
retained cash flow (operating cash flow plus dividends from associates less
interest, tax, dividends to minorities and equity dividends) to net debt; and
operating cash flow (plus dividends from associates) to net debt. These
internal ratios establish levels of debt that the Group should not exceed
other than for relatively short periods of time and are shared with the Group’s
debt rating agencies being Moody’s, Fitch Ratings and Standard & Poor’s.
The Group complied with these ratios throughout the financial year.
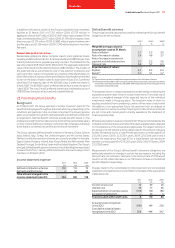
Financial risk management
The Group’s treasury function provides a centralised service to the Group
for funding, foreign exchange, interest rate management and counterparty
risk management.
Treasury operations are conducted within a framework of policies and
guidelines authorised and reviewed by the Board, most recently on
1 February 2011. A treasury risk committee comprising of the Group’s Chief
Financial Officer, Group General Counsel and Company Secretary, Corporate
Finance Director and Director of Financial Reporting meets at least annually
to review treasury activities and its members receive management
information relating to treasury activities on a quarterly basis. The Group
accounting function, which does not report to the Group Corporate
Finance Director, provides regular update reports of treasury activity to
the Board. The Group’s internal auditor reviews the internal control
environment regularly.
The Group uses a number of derivative instruments for currency and interest
rate risk management purposes only that are transacted by specialist
treasury personnel. The Group mitigates banking sector credit risk by the
use of collateral support agreements.
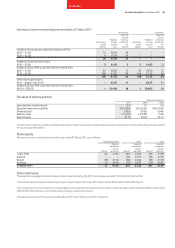
Credit risk
The Group considers its exposure to credit risk at 31 March to be as follows:
2011 2010
£m £m
Bank deposits 896 745
Cash held in restricted deposits 338 274
Government bonds 610 388
Money market fund investments 5,015 3,678
Derivative financial instruments 2,045 2,128
Other investments – debt and bonds 75 2,366
Trade receivables 4,277 4,067
Other receivables 3,325 1,800
16,581 15,446
The Group invests in UK index linked government bonds on the basis that
they generate a swap return in excess of £ LIBOR and are amongst the most
creditworthy of investments available.
Money market investments are in accordance with established internal
treasury policies which dictate that an investment’s long-term credit
rating is no lower than single A. Additionally, the Group invests in AAA
unsecured money market mutual funds where the investment is limited to
10% of each fund.
In respect of financial instruments used by the Group’s treasury function,
the aggregate credit risk the Group may have with one counterparty is
limited by firstly, reference to the long-term credit ratings assigned for that
counterparty by Moody’s, Fitch Ratings and Standard & Poor’s and secondly,
as a consequence of collateral support agreements introduced from the
fourth quarter of 2008. Under collateral support agreements the Group’s
exposure to a counterparty with whom a collateral support agreement is in
place is reduced to the extent that the counterparty must post cash
collateral when there is value due to the Group under outstanding derivative
contracts that exceeds a contractually agreed threshold amount. When
value is due to the counterparty the Group is required to post collateral on
identical terms. Such cash collateral is adjusted daily as necessary.
In the event of any default ownership of the cash collateral would revert to
the respective holder at that point. Detailed below is the value of the cash
collateral, which is reported within short-term borrowings, held by the
Group at 31 March 2011:
2011 2010
£m £m
Cash collateral 531 604
The majority of the Group’s trade receivables are due for maturity within 90
days and largely comprise amounts receivable from consumers and
business customers. At 31 March 2011 £2,233 million (2010: £2,111 million)
of trade receivables were not yet due for payment. Total trade receivables
consisted of £2,852 million (2010: £2,709 million) relating to the Europe
region and £1,425 million (2010: £1,358 million) relating to the Africa, Middle
East and Asia Pacific region. Accounts are monitored by management and
provisions for bad and doubtful debts raised where it is deemed appropriate.