Vectren 2014 Annual Report Download - page 2
Download and view the complete annual report
Please find page 2 of the 2014 Vectren annual report below. You can navigate through the pages in the report by either clicking on the pages listed below, or by using the keyword search tool below to find specific information within the annual report.-
 1
1 -
 2
2 -
 3
3 -
 4
4 -
 5
5 -
 6
6 -
 7
7 -
 8
8 -
 9
9 -
 10
10 -
 11
11 -
 12
12 -
 13
13 -
14
-
15
-
16
-
17
-
18
-
19
-
20
-
21
-
22
-
23
-
24
-
25
-
26
-
27
-
28
-
29
-
30
-
31
-
32
-
33
-
34
-
35
-
36
-
37
-
38
-
39
-
40
-
41
-
42
-
43
-
44
-
45
-
46
-
47
-
48
-
49
-
50
-
51
-
52
-
53
-
54
-
55
-
56
-
57
-
58
-
59
-
60
-
61
-
62
-
63
-
64
-
65
-
66
-
67
-
68
-
69
-
70
-
71
-
72
-
73
-
74
-
75
-
76
-
77
-
78
-
79
-
80
-
81
-
82
-
83
-
84
-
85
-
86
-
87
-
88
-
89
-
90
-
91
-
92
-
93
-
94
-
95
-
96
-
97
-
98
-
99
-
100
-
101
-
102
-
103
-
104
-
105
-
106
-
107
-
108
-
109
-
110
-
111
-
112
-
113
-
114
-
115
-
116
-
117
-
118
-
119
-
120
-
121
-
122
-
123
-
124
-
125
-
126
-
127
-
128
-
129
-
130
-
131
-
132
 |
 |

Table of Contents
Letter to Shareholders.................................................. 1
Vectren at a Glance ..................................................... 4
Form 10-K ................................................................... 5
Management’s Discussion and Analysis ................. 29
Financial Statements and Notes ............................. 64
5-Year Financial Review ........................................... 126
Performance Chart ................................................... 127
Shareholder Information ........................................... 128
Directors and Officers .............................................. 129
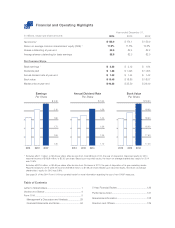
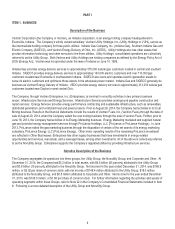
Year ended December 31,
In millions, except per share amounts 2014 2013 2012
Net income 1 $ 188.0 $ 174.1 $ 159.0
Return on average common shareholders’ equity (ROE) 111.9% 11.3% 10.6%
Shares outstanding at year-end 82.6 82.4 82.2
Average shares outstanding for basic earnings 82.5 82.3 82.0
Per Common Share
Basic earnings 1$ 2.28 $ 2.12 $ 1.94
Dividends paid $ 1.46 $ 1.425 $ 1.405
Annual dividend rate at year-end $ 1.52 $ 1.44 $ 1.42
Book value $ 19.45 $ 18.86 $ 18.57
Market price at year-end $ 46.23 $ 35.50 $ 29.40
Excludes a $21.1 million, or $0.26 per share, after-tax loss from Coal Mining in 2014, the year of disposition. Reported results for 2014
were net income of $166.9 million, or $2.02 per share. Based upon reported results, the return on average shareholders’ equity for 2014
was 10.5%.
Excludes a $37.5 million, or $0.46 per share, after-tax loss from ProLiance in 2013, the year of disposition of its gas marketing assets.
Reported results for 2013 were net income of $136.6 million, or $1.66 per share. Based upon reported results, the return on average
shareholders’ equity for 2013 was 8.9%.
See page 31 of the 2014 Form 10-K incorporated herein for more information regarding the use of non-GAAP measures.
1
Annual Dividend Rate
Per Share
$ 1.60
1.50
1.40
1.30
1.20
1.10
2012 2013 2014
Earnings
Per Share
$ 2.30
2.10
1.90
1.70
1.50
1.30
2012 2013 2014
1
Book Value
Per Share
$ 19.50
19.00
18.50
18.00
17.50
17.00
2012 2013 2014
Financial and Operating Highlights
1