Unum 2010 Annual Report Download - page 2
Download and view the complete annual report
Please find page 2 of the 2010 Unum annual report below. You can navigate through the pages in the report by either clicking on the pages listed below, or by using the keyword search tool below to find specific information within the annual report.-
 1
1 -
 2
2 -
 3
3 -
 4
4 -
 5
5 -
 6
6 -
 7
7 -
 8
8 -
 9
9 -
 10
10 -
 11
11 -
 12
12 -
 13
13 -
14
-
15
-
16
-
17
-
18
-
19
-
20
-
21
-
22
-
23
-
24
-
25
-
26
-
27
-
28
-
29
-
30
-
31
-
32
-
33
-
34
-
35
-
36
-
37
-
38
-
39
-
40
-
41
-
42
-
43
-
44
-
45
-
46
-
47
-
48
-
49
-
50
-
51
-
52
-
53
-
54
-
55
-
56
-
57
-
58
-
59
-
60
-
61
-
62
-
63
-
64
-
65
-
66
-
67
-
68
-
69
-
70
-
71
-
72
-
73
-
74
-
75
-
76
-
77
-
78
-
79
-
80
-
81
-
82
-
83
-
84
-
85
-
86
-
87
-
88
-
89
-
90
-
91
-
92
-
93
-
94
-
95
-
96
-
97
-
98
-
99
-
100
-
101
-
102
-
103
-
104
-
105
-
106
-
107
-
108
-
109
-
110
-
111
-
112
-
113
-
114
-
115
-
116
-
117
-
118
-
119
-
120
-
121
-
122
-
123
-
124
-
125
-
126
-
127
-
128
-
129
-
130
-
131
-
132
-
133
-
134
-
135
-
136
-
137
-
138
-
139
-
140
-
141
-
142
-
143
-
144
-
145
-
146
-
147
-
148
-
149
-
150
-
151
-
152
-
153
-
154
-
155
-
156
-
157
-
158
-
159
-
160
-
161
-
162
 |
 |

b
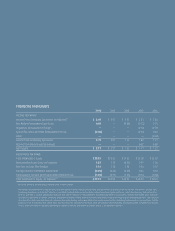
FINANCIAL HIGHLIGHTS
2010 2009 2008 2007 2006
INCOME PER SHARE*
Income from Continuing Operations, As Adjusted** $ 2.69 $ 2.57 $ 2.51 $ 2.21 $ 1.80
Net Realized Investment Gain (Loss) 0.05 — (0.89) (0.12) 0.01
Regulatory Reassessment Charges — — — (0.10) (0.79)
Special Tax Items and Debt Extinguishment Costs (0.03) — — (0.10) 0.23
Other — — — — (0.04)
Income from Continuing Operations 2.71 2.57 1.62 1.89 1.21
Income from Discontinued Operations — — — 0.02 0.02
Net Income $ 2.71 $ 2.57 $ 1.62 $ 1.91 $ 1.23
BOOK VALUE PER SHARE
Total Stockholders’ Equity $ 28.25 $ 25.62 $ 19.32 $ 22.28 $ 22.53
Net Unrealized Gain (Loss) on Securities 1.29 1.14 (2.51) 0.99 1.56
Net Gain on Cash Flow Hedges 1.14 1.12 1.38 0.50 0.57
Foreign Currency Translation Adjustment (0.35) (0.24) (0.54) 0.35 0.34
Unrecognized Pension and Postretirement Benefit Costs (1.00) (0.99) (1.23) (0.55) (0.68)
Total Stockholders’ Equity, As Adjusted** $ 27.17 $ 24.59 $ 22.22 $ 20.99 $ 20.74
* Per Share Amounts for Operating Statement Data Assume Dilution.
** We analyze our performance using non-GAAP financial measures which exclude certain items and the related tax thereon from net income. We believe “Income from
Continuing Operations, As Adjusted,” which is a non-GAAP financial measure and excludes realized investment gains and losses, which are recurring, and certain other
items as specified, is a better performance measure and a better indicator of the profitability and underlying trends in our business. Realized investment gains and losses
are primarily dependent on market conditions and general economic events and are not necessarily related to decisions regarding our underlying business. The exclusion
of certain other items specified above also enhances the understanding and comparability of our performance and the underlying fundamentals in our operations, but this
exclusion is not an indication that similar items may not recur. We also believe that book value per common share excluding accumulated other comprehensive income
or loss, which also tends to fluctuate depending on market conditions and general economic trends, is an important measure.