Union Pacific 2012 Annual Report Download - page 7
Download and view the complete annual report
Please find page 7 of the 2012 Union Pacific annual report below. You can navigate through the pages in the report by either clicking on the pages listed below, or by using the keyword search tool below to find specific information within the annual report.-
 1
1 -
 2
2 -
 3
3 -
 4
4 -
 5
5 -
 6
6 -
 7
7 -
 8
8 -
 9
9 -
 10
10 -
 11
11 -
 12
12 -
 13
13 -
 14
14 -
 15
15 -
 16
16 -
 17
17 -
 18
18 -
19
-
20
-
21
-
22
-
23
-
24
-
25
-
26
-
27
-
28
-
29
-
30
-
31
-
32
-
33
-
34
-
35
-
36
-
37
-
38
-
39
-
40
-
41
-
42
-
43
-
44
-
45
-
46
-
47
-
48
-
49
-
50
-
51
-
52
-
53
-
54
-
55
-
56
-
57
-
58
-
59
-
60
-
61
-
62
-
63
-
64
-
65
-
66
-
67
-
68
-
69
-
70
-
71
-
72
-
73
-
74
-
75
-
76
-
77
-
78
-
79
-
80
-
81
-
82
-
83
-
84
-
85
-
86
-
87
-
88
-
89
-
90
-
91
-
92
-
93
-
94
-
95
-
96
-
97
-
98
-
99
-
100
-
101
 |
 |
7
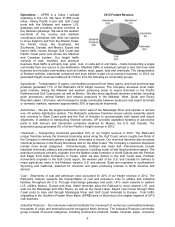
goods, lumber and other miscellaneous products. In 2012, this group generated 18% of Union Pacific’s
total freight revenue. Commercial and highway construction drives shipments of steel and construction
products, consisting of rock, cement and roofing materials. Oil and gas drilling generates demand for raw
steel, finished pipe, frac sand and drilling fluid products. Industrial manufacturing plants receive
nonferrous metals and industrial minerals. Paper and consumer goods, including furniture and
appliances, move to major metropolitan areas for consumers. Lumber shipments originate primarily in the
Pacific Northwest and Canada and move throughout the U.S. for use in new home construction and
repair and remodeling.
Intermodal – Our Intermodal business includes two shipment categories: international and domestic.
International business consists of imported and exported container traffic that mainly passes through
West Coast ports served by UP’s extensive terminal network. Domestic business includes container and
trailer traffic picked up and delivered within North America for intermodal marketing companies (primarily
shipper agents and logistics companies), as well as truckload carriers. Less-than-truckload and package
carriers with time-sensitive business requirements are also an important part of these domestic
shipments. Together, international and domestic business generated 20% of UP’s 2012 freight revenue.
Seasonality – Some of the commodities we carry have peak shipping seasons, reflecting either or both
the nature of the commodity, such as certain agricultural and food products that have specific growing
and harvesting seasons, and the demand cycle for the commodity, such as intermodal traffic, which
generally has a peak shipping season during the third quarter to meet holiday-related demand for
consumer goods during the fourth quarter. The peak shipping seasons for these commodities can vary
considerably from year to year depending upon various factors, including the strength of domestic and
international economies and currencies and the strength of harvests and market prices for agricultural
products. In response to an annual request delivered by the Surface Transportation Board (STB) of the
U.S. Department of Transportation (DOT) to all of the Class I railroads operating in the U.S., we issue a
publicly available letter during the third quarter detailing our plans for handling traffic during the third and
fourth quarters and providing other information requested by the STB.
Working Capital – At December 31, 2012 and 2011, we had a working capital surplus. This reflects a
strong cash position, which provides enhanced liquidity in an uncertain economic environment. In
addition, we believe we have adequate access to capital markets to meet any foreseeable cash
requirements, and we have sufficient financial capacity to satisfy our current liabilities.
Competition – We are subject to competition from other railroads, motor carriers, ship and barge
operators, and pipelines. Our main rail competitor is Burlington Northern Santa Fe LLC. Its rail subsidiary,
BNSF Railway Company (BNSF), operates parallel routes in many of our main traffic corridors. In
addition, we operate in corridors served by other railroads and motor carriers. Motor carrier competition
exists for five of our six commodity groups (excluding coal). Because of the proximity of our routes to
major inland and Gulf Coast waterways, barges can be particularly competitive, especially for grain and
bulk commodities. In addition to price competition, we face competition with respect to transit times and
quality and reliability of service. While we must build or acquire and maintain our rail system, trucks and
barges are able to use public rights-of-way maintained by public entities. Any future improvements or
expenditures materially increasing the quality or reducing the costs of these alternative modes of
transportation, or legislation releasing motor carriers from their size or weight limitations, could have a
material adverse effect on our business.
Key Suppliers – We depend on two key domestic suppliers of high horsepower locomotives. Due to the
capital intensive nature of the locomotive manufacturing business and sophistication of this equipment,
potential new suppliers face high barriers of entry into this industry. Therefore, if one of these domestic
suppliers discontinues manufacturing locomotives for any reason, including insolvency or bankruptcy, we
could experience a significant cost increase and risk reduced availability of the locomotives that are
necessary to our operations. Additionally, for a high percentage of our rail purchases, we utilize two
suppliers (one domestic and one international) that meet our specifications. Rail is critical for both
maintenance of our network and replacement and improvement or expansion of our network and facilities.
Rail manufacturing also has high barriers of entry, and, if one of those suppliers discontinues operations
for any reason, including insolvency or bankruptcy, we could experience cost increases and difficulty
obtaining rail.
Employees – Approximately 86% of our 45,928 full-time-equivalent employees are represented by 14
major rail unions. During the year, we concluded the most recent round of negotiations, which began in