Unilever 2011 Annual Report Download - page 9
Download and view the complete annual report
Please find page 9 of the 2011 Unilever annual report below. You can navigate through the pages in the report by either clicking on the pages listed below, or by using the keyword search tool below to find specific information within the annual report.-
 1
1 -
 2
2 -
 3
3 -
 4
4 -
 5
5 -
 6
6 -
 7
7 -
 8
8 -
 9
9 -
 10
10 -
 11
11 -
 12
12 -
 13
13 -
 14
14 -
 15
15 -
 16
16 -
 17
17 -
 18
18 -
 19
19 -
 20
20 -
21
-
22
-
23
-
24
-
25
-
26
-
27
-
28
-
29
-
30
-
31
-
32
-
33
-
34
-
35
-
36
-
37
-
38
-
39
-
40
-
41
-
42
-
43
-
44
-
45
-
46
-
47
-
48
-
49
-
50
-
51
-
52
-
53
-
54
-
55
-
56
-
57
-
58
-
59
-
60
-
61
-
62
-
63
-
64
-
65
-
66
-
67
-
68
-
69
-
70
-
71
-
72
-
73
-
74
-
75
-
76
-
77
-
78
-
79
-
80
-
81
-
82
-
83
-
84
-
85
-
86
-
87
-
88
-
89
-
90
-
91
-
92
-
93
-
94
-
95
-
96
-
97
-
98
-
99
-
100
-
101
-
102
-
103
-
104
-
105
-
106
-
107
-
108
-
109
-
110
-
111
-
112
-
113
-
114
-
115
-
116
-
117
-
118
-
119
-
120
-
121
-
122
-
123
-
124
-
125
-
126
-
127
-
128
-
129
-
130
-
131
-
132
-
133
 |
 |

6
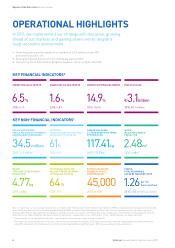
OPERATIONAL HIGHLIGHTS
In 2011, we implemented our strategy with discipline, growing
ahead of our markets and gaining share overall despite a
tough economic environment.
• Underlying sales growth ahead of our markets at 6.5% with price up 4.8%
and volume growth 1.6%
• Emerging markets delivered 11.5% underlying sales growth
• Turnover up 5% at €46.5 billion despite a negative currency impact of (2.5)%
KEY FINANCIAL INDICATORS*
UNDERLYING SALES GROWTH
6.5%
2010: 4.1%
UNDERLYING VOLUME GROWTH
1.6%
2010: 5.8%
UNDERLYING OPERATING MARGIN
14.9%
2010: 15.0%
FREE CASH FLOW
€3.1 billion
2010: €3.4 billion
KEY NONFINANCIAL INDICATORS†
HEALTH AND HYGIENE:
PEOPLE REACHED WITH LIFEBUOY
HANDWASHING PROGRAMMES
34.5 million
2010: 13.5 million
NUTRITION:
PRODUCTS MEETING SALT LEVELS
EQUIVALENT TO 5GPER DAY
61%
2010: 60%
GREENHOUSE GASES:
CO2 FROM ENERGY PER TONNE
OF PRODUCTION
117.41kg
2010: 133.59kg
WATER:
WATER PER TONNE OF
PRODUCTION
2.48m3
2010: 2.68m3
WASTE:
TOTAL WASTE PER TONNE OF
PRODUCTION
4.77kg
2010: 6.48kg
SUSTAINABLE SOURCING:
PALM OIL PURCHASES FROM
SUSTAINABLE SOURCES
64%
2010: 37%
BETTER LIVELIHOODS:
NUMBER OF SHAKTI
ENTREPRENEURS
45,000
2010: 45,000
PEOPLE:
TOTAL RECORDABLE
ACCIDENT FREQUENCY RATE
1.26per 1m
hours worked
2010: 1.63 per 1m hours worked
Unilever Annual Report and Accounts 2011
Report of the Directors About Unilever
Basis of reporting: our accounting policies are in accordance with International Financial Reporting Standards (IFRS) as adopted by the European Union (EU) and
as issued by the International Accounting Standards Board (IASB), as well as UnitedKingdom and Dutch law. Certain measures used in ourreporting are not
defined under IFRS or other generally accepted accounting principles. For further information about these measures, and the reasons why we believethey are
important for an understanding of the performance of the business, please refer to our commentary on non-GAAP measures on pages 26 and 27.
* Further details of our key financial indicators can be found in our financial review starting on page 20.
† These key non-financial indicators form part of the Unilever Sustainable Living Plan. 2011 data is preliminary. It will be independently assured by the end of
June2012 and reported in the online version of the Unilever Sustainable Living Plan report 2011 at www.unilever.com/sustainability.