Unilever 2011 Annual Report Download - page 10
Download and view the complete annual report
Please find page 10 of the 2011 Unilever annual report below. You can navigate through the pages in the report by either clicking on the pages listed below, or by using the keyword search tool below to find specific information within the annual report.-
 1
1 -
 2
2 -
 3
3 -
 4
4 -
 5
5 -
 6
6 -
 7
7 -
 8
8 -
 9
9 -
 10
10 -
 11
11 -
 12
12 -
 13
13 -
 14
14 -
 15
15 -
 16
16 -
 17
17 -
 18
18 -
 19
19 -
 20
20 -
 21
21 -
22
-
23
-
24
-
25
-
26
-
27
-
28
-
29
-
30
-
31
-
32
-
33
-
34
-
35
-
36
-
37
-
38
-
39
-
40
-
41
-
42
-
43
-
44
-
45
-
46
-
47
-
48
-
49
-
50
-
51
-
52
-
53
-
54
-
55
-
56
-
57
-
58
-
59
-
60
-
61
-
62
-
63
-
64
-
65
-
66
-
67
-
68
-
69
-
70
-
71
-
72
-
73
-
74
-
75
-
76
-
77
-
78
-
79
-
80
-
81
-
82
-
83
-
84
-
85
-
86
-
87
-
88
-
89
-
90
-
91
-
92
-
93
-
94
-
95
-
96
-
97
-
98
-
99
-
100
-
101
-
102
-
103
-
104
-
105
-
106
-
107
-
108
-
109
-
110
-
111
-
112
-
113
-
114
-
115
-
116
-
117
-
118
-
119
-
120
-
121
-
122
-
123
-
124
-
125
-
126
-
127
-
128
-
129
-
130
-
131
-
132
-
133
 |
 |

Unilever Annual Report and Accounts 2011
Report of the Directors About Unilever
7
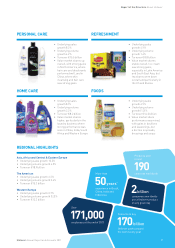
PERSONAL CARE
• Underlying sales
growth 8.2%
• Underlying volume
growth 4.2%
• Turnover €15.5 billion
• Value market shares up
overall, with strong gains
in North America, where
hair care and deodorants
performed well, and in
China, where skin
cleansing and hair care
saw strong gains
REFRESHMENT
• Underlying sales
growth 4.9%
• Underlying volume
growth 1.4%
• Turnover €8.8 billion
• Value market shares
stable overall. Ice cream
saw strong gains,
especially in Latin America
and South East Asia, but
tea shares were down
overall and particularly in
the US and Russia
HOME CARE
• Underlying sales
growth 8.1%
• Underlying volume
growth 2.2%
• Turnover €8.2 billion
• Value market shares
higher, particularly in the
laundry business where
strong performance was
seen in China, India, South
Africa and Western Europe
FOODS
• Underlying sales
growth 4.9%
• Underlying volume
growth (1.2)%
• Turnover €14.0 billion
• Value market share
performance was mixed,
with gains in bouillons
and seasonings, but
a decline in spreads,
dressings and soups
REGIONAL HIGHLIGHTS
Asia, Africa and Central & Eastern Europe
• Underlying sales growth 10.5%
• Underlying volume growth 4.5%
• Turnover €18.9 billion
The Americas
• Underlying sales growth 6.3%
• Underlying volume growth 0.4%
• Turnover €15.3 billion
Western Europe
• Underlying sales growth 0.7%
• Underlying volume growth (1.2)%
• Turnover €12.3 billion
Products sold
in over
190
countries worldwide
50 years’
More than
experience in Brazil,
China,India and
Indonesia 2 billion
consumers worldwide
use a Unilever product
on any given day
171,000
Over
employees at the end of 2011
Consumers buy
170 billion
Unilever packs around
the world every year