Ubisoft 2007 Annual Report Download - page 11
Download and view the complete annual report
Please find page 11 of the 2007 Ubisoft annual report below. You can navigate through the pages in the report by either clicking on the pages listed below, or by using the keyword search tool below to find specific information within the annual report.-
 1
1 -
 2
2 -
 3
3 -
 4
4 -
 5
5 -
 6
6 -
 7
7 -
 8
8 -
 9
9 -
 10
10 -
 11
11 -
 12
12 -
 13
13 -
 14
14 -
 15
15 -
 16
16 -
 17
17 -
 18
18 -
 19
19 -
 20
20 -
 21
21 -
 22
22 -
23
-
24
-
25
-
26
-
27
-
28
-
29
-
30
-
31
-
32
-
33
-
34
-
35
-
36
-
37
-
38
-
39
-
40
-
41
-
42
-
43
-
44
-
45
-
46
-
47
-
48
-
49
-
50
-
51
-
52
-
53
-
54
-
55
-
56
-
57
-
58
-
59
-
60
-
61
-
62
-
63
-
64
-
65
-
66
-
67
-
68
-
69
-
70
-
71
-
72
-
73
-
74
-
75
-
76
-
77
-
78
-
79
-
80
-
81
-
82
-
83
-
84
-
85
-
86
-
87
-
88
-
89
-
90
-
91
-
92
-
93
-
94
-
95
-
96
-
97
-
98
-
99
-
100
-
101
-
102
-
103
-
104
-
105
-
106
-
107
-
108
-
109
-
110
-
111
-
112
-
113
-
114
-
115
-
116
-
117
-
118
-
119
-
120
-
121
-
122
-
123
-
124
-
125
-
126
-
127
-
128
-
129
-
130
-
131
-
132
-
133
-
134
-
135
-
136
-
137
-
138
-
139
-
140
-
141
-
142
-
143
-
144
-
145
-
146
-
147
-
148
-
149
-
150
-
151
-
152
-
153
-
154
-
155
-
156
-
157
-
158
-
159
-
160
-
161
-
162
-
163
-
164
-
165
-
166
-
167
-
168
-
169
-
170
 |
 |

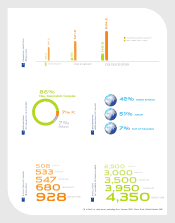
2,
500
2003-04
2004-05
3,000
3,
500
3
,950
4,350
2005-06
2006-07
2007-08
508
7%
Others
86%
New-Generation Consoles
7% PC
7% REST OF THE WORLD
51% EUROPE
2003-04
2004-05
533
547
68
0
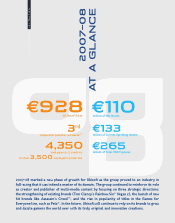
928
evolution of sales
(€ million)
evolution
of number of employees
breakdown
of sales by platform
geographic
breakdown of sales
2005-06
2006-07
2007-08
financial position
(€ million)
42% NORTH AMERICA
521.
8
381
.
3
634.2
03/31/2007
03/31/2006
shareholder’s equity
net debt/net cash
03/31/2008
149.5
-65.3
55
(1) In 2007, in value terms, excluding Asia. Sources: NPD, Chart-Track, Media Control, GfK.