US Bank 2015 Annual Report Download - page 5
Download and view the complete annual report
Please find page 5 of the 2015 US Bank annual report below. You can navigate through the pages in the report by either clicking on the pages listed below, or by using the keyword search tool below to find specific information within the annual report.-
 1
1 -
 2
2 -
 3
3 -
 4
4 -
 5
5 -
 6
6 -
 7
7 -
 8
8 -
 9
9 -
 10
10 -
 11
11 -
 12
12 -
 13
13 -
 14
14 -
 15
15 -
 16
16 -
17
-
18
-
19
-
20
-
21
-
22
-
23
-
24
-
25
-
26
-
27
-
28
-
29
-
30
-
31
-
32
-
33
-
34
-
35
-
36
-
37
-
38
-
39
-
40
-
41
-
42
-
43
-
44
-
45
-
46
-
47
-
48
-
49
-
50
-
51
-
52
-
53
-
54
-
55
-
56
-
57
-
58
-
59
-
60
-
61
-
62
-
63
-
64
-
65
-
66
-
67
-
68
-
69
-
70
-
71
-
72
-
73
-
74
-
75
-
76
-
77
-
78
-
79
-
80
-
81
-
82
-
83
-
84
-
85
-
86
-
87
-
88
-
89
-
90
-
91
-
92
-
93
-
94
-
95
-
96
-
97
-
98
-
99
-
100
-
101
-
102
-
103
-
104
-
105
-
106
-
107
-
108
-
109
-
110
-
111
-
112
-
113
-
114
-
115
-
116
-
117
-
118
-
119
-
120
-
121
-
122
-
123
-
124
-
125
-
126
-
127
-
128
-
129
-
130
-
131
-
132
-
133
-
134
-
135
-
136
-
137
-
138
-
139
-
140
-
141
-
142
-
143
-
144
-
145
-
146
-
147
-
148
-
149
-
150
-
151
-
152
-
153
-
154
-
155
-
156
-
157
-
158
-
159
-
160
-
161
-
162
-
163
-
164
-
165
-
166
-
167
-
168
-
169
-
170
-
171
-
172
-
173
 |
 |

— 3 —
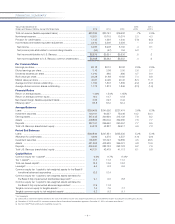
Years ended December 31 2015 2014
(Dollars and Shares in Millions, Except Per Share Data) 2015 2014 2013 v 2014 v 2013
Total net revenue (taxable-equivalent basis) ......................................... $20,306 $20,161 $19,602 .7% 2.9%
Noninterest expense ............................................................................ 10,931 10,715 10,274 2.0 4.3
Provision for credit losses .................................................................... 1,132 1,229 1,340 (7.9) (8.3)
Income taxes and taxable-equivalent adjustment .................................. 2,310 2,309 2,256 – 2.3
Net income ....................................................................................... 5,933 5,908 5,732 .4 3.1
Net (income) loss attributable to noncontrolling interests .................... (54) (57) 104 5.3 *
Net income attributable to U.S. Bancorp ........................................... $5,879 $5,851 $5,836 .5 .3
Net income applicable to U.S. Bancorp common shareholders ......... $5,608 $5,583 $5,552 .4 .6
Per Common Share
Earnings per share ................................................................................ $3.18 $3.10 $3.02 2.6% 2.6%
Diluted earnings per share .................................................................... 3.16 3.08 3.00 2.6 2.7
Dividends declared per share ................................................................ 1.010 .965 .885 4.7 9.0
Book value per share ............................................................................ 23.28 21.68 19.92 7.4 8.8
Market value per share ......................................................................... 42.67 44.95 40.40 (5.1) 11.3
Average common shares outstanding ................................................... 1,764 1,803 1,839 (2.2) (2.0)
Average diluted common shares outstanding ....................................... 1,772 1,813 1,849 (2.3) (1.9)
Financial Ratios
Return on average assets ..................................................................... 1.44% 1.54% 1.65%
Return on average common equity ....................................................... 14.0 14.7 15.8
Net interest margin (taxable-equivalent basis) ....................................... 3.05 3.23 3.44
Efciency ratio(a) .................................................................................... 53.8 53.2 52.4
Average Balances
Loans ................................................................................................ $250,459 $241,692 $227,474 3.6% 6.3%
Investment securities ............................................................................ 103,161 90,327 75,046 14.2 20.4
Earning assets ...................................................................................... 367,445 340,994 315,139 7.8 8.2
Assets ................................................................................................ 408,865 380,004 352,680 7.6 7.7
Deposits ............................................................................................... 287,151 266,640 250,457 7.7 6.5
Total U.S. Bancorp shareholders’ equity ............................................... 44,813 42,837 39,917 4.6 7.3
Period End Balances
Loans ................................................................................................ $260,849 $247,851 $235,235 5.2% 5.4%
Allowance for credit losses ................................................................... 4,306 4,375 4,537 (1.6) (3.6)
Investment securities ............................................................................ 105,587 101,043 79,855 4.5 26.5
Assets ................................................................................................ 421,853 402,529 364,021 4.8 10.6
Deposits ............................................................................................... 300,400 282,733 262,123 6.2 7.9
Total U.S. Bancorp shareholders’ equity ............................................... 46,131 43,479 41,113 6.1 5.8
Capital Ratios
Common equity tier 1 capital(b) .............................................................. 9.6% 9.7% 9.4%(c)
Tier 1 capital(b)....................................................................................... 11.3 11.3 11.2
Total risk-based capital(b) ....................................................................... 13.3 13.6 13.2
Leverage(b) ............................................................................................ 9.5 9.3 9.6
Common equity tier 1 capital to risk-weighted assets for the Basel III
transitional advanced approaches .................................................... 12.5 12.4
Common equity tier 1 capital to risk-weighted assets estimated for
the Basel III fully implemented standardized approach(c) .................... 9.1 9.0 8.8
Common equity tier 1 capital to risk-weighted assets estimated for
the Basel III fully implemented advanced approaches(c) ..................... 11.9 11.8
Tangible common equity to tangible assets(c) ......................................... 7.6 7.5 7.7
Tangible common equity to risk-weighted assets(c) ................................ 9.2 9.3 9.1
* Not meaningful.
(a) Computed as noninterest expense divided by the sum of net interest income on a taxable-equivalent basis and noninterest income excluding net securities gains (losses).
(b) December 31, 2015 and 2014, calculated under the Basel III transitional standardized approach; December 31, 2013, calculated under Basel I.
(c) See Non-GAAP Financial Measures beginning on page 73.
FINANCIAL SUMMARY