US Bank 2014 Annual Report Download - page 4
Download and view the complete annual report
Please find page 4 of the 2014 US Bank annual report below. You can navigate through the pages in the report by either clicking on the pages listed below, or by using the keyword search tool below to find specific information within the annual report.-
 1
1 -
 2
2 -
 3
3 -
 4
4 -
 5
5 -
 6
6 -
 7
7 -
 8
8 -
 9
9 -
 10
10 -
 11
11 -
 12
12 -
 13
13 -
 14
14 -
 15
15 -
16
-
17
-
18
-
19
-
20
-
21
-
22
-
23
-
24
-
25
-
26
-
27
-
28
-
29
-
30
-
31
-
32
-
33
-
34
-
35
-
36
-
37
-
38
-
39
-
40
-
41
-
42
-
43
-
44
-
45
-
46
-
47
-
48
-
49
-
50
-
51
-
52
-
53
-
54
-
55
-
56
-
57
-
58
-
59
-
60
-
61
-
62
-
63
-
64
-
65
-
66
-
67
-
68
-
69
-
70
-
71
-
72
-
73
-
74
-
75
-
76
-
77
-
78
-
79
-
80
-
81
-
82
-
83
-
84
-
85
-
86
-
87
-
88
-
89
-
90
-
91
-
92
-
93
-
94
-
95
-
96
-
97
-
98
-
99
-
100
-
101
-
102
-
103
-
104
-
105
-
106
-
107
-
108
-
109
-
110
-
111
-
112
-
113
-
114
-
115
-
116
-
117
-
118
-
119
-
120
-
121
-
122
-
123
-
124
-
125
-
126
-
127
-
128
-
129
-
130
-
131
-
132
-
133
-
134
-
135
-
136
-
137
-
138
-
139
-
140
-
141
-
142
-
143
-
144
-
145
-
146
-
147
-
148
-
149
-
150
-
151
-
152
-
153
-
154
-
155
-
156
-
157
-
158
-
159
-
160
-
161
-
162
-
163
-
164
-
165
-
166
-
167
-
168
-
169
-
170
-
171
-
172
-
173
 |
 |

2
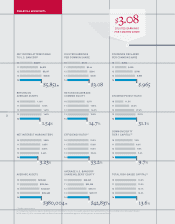
FINANCIAL HIGHLIGHTS
NET INCOME ATTRIBUTABLE
TO U.S.BANCORP
DILUTED EARNINGS
PER COMMON SHARE
DIVIDENDS DECLARED
PER COMMON SHARE
10 $3,317
11 $4,872
12 $5,647
13 $5,836
14
10 $1.73
11 $2.46
12 $2.84
13 $3.00
14
10 $.200
11 $.500
12 $.780
13 $.885
14
RETURN ON
AVERAGE ASSETS
RETURN ON AVERAGE
COMMON EQUITY DIVIDEND PAYOUT RATIO
10 1.16%
11 1.53%
12 1.65%
13 1.65%
14
10 12.7%
11 15.8%
12 16.2%
13 15.8%
14
10 11.5%
11 20.2%
12 27.4%
13 29.3%
14
NET INTEREST MARGIN TEB* EFFICIENCY RATIOa
COMMON EQUITY
TIER 1 CAPITALb
10 3.88%
11 3.65%
12 3.58%
13 3.44%
14
10 51.5%
11 51.8%
12 51.5%
13 52.4%
14
10 7.8%
11 8.6%
12 9.0%
13 9.4%
14
AVERAGE ASSETS
AVERAGE U.S.BANCORP
SHAREHOLDERS’ EQUITY TOTAL RISKBASED CAPITALb
10 $285,861
11 $318,264
12 $342,849
13 $352,680
14
10 $28,049
11 $32,200
12 $37,611
13 $39,917
14
10 13.3%
11 13.3%
12 13.1%
13 13.2%
14
DILUTED EARNINGS
PER COMMON SHARE
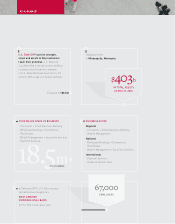
$3.08
* Taxable equivalent basis.
(a) Computed as noninterest expense divided by the sum of net interest income on a taxable-equivalent basis and noninterest income excluding net securities gains (losses).
(b) December 31, 2014, calculated under the Basel III transitional standardized approach; all other periods calculated under Basel I.
$380,004m$42,837m13.6%
3.23%
1.54%
$5,851m
53.2%
14.7%
$3.08
9.7%
31.1%
$.965