Toshiba 2006 Annual Report Download - page 5
Download and view the complete annual report
Please find page 5 of the 2006 Toshiba annual report below. You can navigate through the pages in the report by either clicking on the pages listed below, or by using the keyword search tool below to find specific information within the annual report.-
 1
1 -
 2
2 -
 3
3 -
 4
4 -
 5
5 -
 6
6 -
 7
7 -
 8
8 -
 9
9 -
 10
10 -
 11
11 -
 12
12 -
 13
13 -
 14
14 -
 15
15 -
 16
16 -
17
-
18
-
19
-
20
-
21
-
22
-
23
-
24
-
25
-
26
-
27
-
28
-
29
-
30
-
31
-
32
-
33
-
34
-
35
-
36
-
37
-
38
-
39
-
40
-
41
-
42
-
43
-
44
-
45
-
46
-
47
-
48
-
49
-
50
-
51
-
52
-
53
-
54
-
55
-
56
-
57
-
58
-
59
-
60
-
61
-
62
-
63
-
64
-
65
-
66
-
67
-
68
-
69
-
70
-
71
-
72
-
73
-
74
-
75
-
76
-
77
-
78
-
79
-
80
-
81
-
82
-
83
-
84
-
85
-
86
 |
 |

Interest-bearing debt
Shareholders’ equity ratio
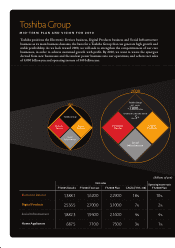
Electronic Devices
Digital Products
Social Infrastructure
Others
Westinghouse
Electronic Devices
Digital Products
Social Infrastructure
(exclude Westinghouse)
Others
FY03–05 FY 06–08
2,040.0
1,132.3
1,260.0
1,057.1
Capital expenditures
(Billions of yen)
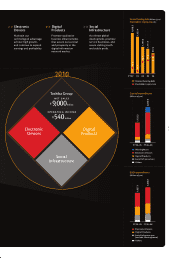
R&D expenditures
(Billions of yen)
Interest-bearing debt
(Billions of yen)
Shareholders’ equity ratio
(%)
FY02 03 04 05 06
13.0 1,818.5
10.9 1,653.4
16.9 1,199.5
17.8 1,111.4
21.2 917.5
FY03–05 FY 06–08
net sales
¥9,000 billion
operating income
¥540 billion
2
0
1
0
Digital
Products
Electronic
Devices
Social
Infrastructure
Toshiba Group
3
2
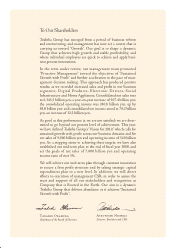
>> Electronic
Devices
Maintain our
technological advantage,
achieve high growth,
and continue to expand
earnings and profitability.
>> Digital
Products
Promote qualitative
business enhancements
that assure our survival
and prosperity in the
digital information
network market.
>> Social
Infrastructure
Accelerate global
development, promote
service businesses, and
assure stable growth
and stable profit.