Toshiba 2006 Annual Report Download - page 2
Download and view the complete annual report
Please find page 2 of the 2006 Toshiba annual report below. You can navigate through the pages in the report by either clicking on the pages listed below, or by using the keyword search tool below to find specific information within the annual report.-
 1
1 -
 2
2 -
 3
3 -
 4
4 -
 5
5 -
 6
6 -
 7
7 -
 8
8 -
 9
9 -
 10
10 -
 11
11 -
 12
12 -
 13
13 -
14
-
15
-
16
-
17
-
18
-
19
-
20
-
21
-
22
-
23
-
24
-
25
-
26
-
27
-
28
-
29
-
30
-
31
-
32
-
33
-
34
-
35
-
36
-
37
-
38
-
39
-
40
-
41
-
42
-
43
-
44
-
45
-
46
-
47
-
48
-
49
-
50
-
51
-
52
-
53
-
54
-
55
-
56
-
57
-
58
-
59
-
60
-
61
-
62
-
63
-
64
-
65
-
66
-
67
-
68
-
69
-
70
-
71
-
72
-
73
-
74
-
75
-
76
-
77
-
78
-
79
-
80
-
81
-
82
-
83
-
84
-
85
-
86
 |
 |

05040302 06 05040302 06 05040302 06
78.2
46.0
28.8
18.5
-254.0
5,836
6,344
5,580
5,656
5,394
26.4
26.5
27.0
26.7
24.5
05040302 06
-29.0
2.9
4.3
5.9
8.6
1,443
1,385
1,330
1,394
1,437
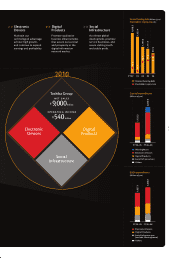
Net Sales &
Gross Profit Margin
(Billions of yen)
SG&A Expenses
(Billions of yen)
Net Income (Loss)
(Billions of yen)
ROE
(%)(%)
Net Sales
Gross Profit Margin
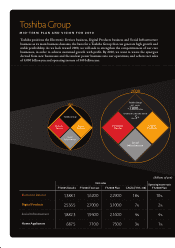
Financial Highlights toshiba corporation and subsidiaries
Thousands of
Millions of yen Change (%) U.S. dollars (Note 1)
2006 2005 2006/2005 2006
Net sales—Japan
—Overseas
Net sales
Operating income (loss) (Note 2)
Income (loss) before income taxes and minority interest
Net income (loss)
Total assets
Shareholders’ equity
Capital expenditures (property, plant and equipment)
Research and development expenditures
Return on equity (ROE) (%)
Return on total assets (ROA) (%)
Yen U.S. dollars
Per share of common stock:
Net income (loss) (Note 3)
—basic
—diluted
Cash dividends
Number of employees (Thousands)
Notes: 1. Unless indicated otherwise, all dollar figures herein refer to U.S. currency. Yen amounts have been translated into U.S. dollars, for convenience only, at the rate of ¥117 = U.S. $ 1.
2.
Operating income (loss) has been determined under financial reporting practices generally accepted in Japan and is defined as net sales less cost of sales and selling, general and administrative
expenses.
3. Basic net income per share (EPS) is computed based on the weighted-average number of shares of common stock outstanding during each period. Diluted EPS assumes the dilution that could
occur if stock acquisition rights were exercised to issue common stock, unless their inclusion would have an antidilutive effect.
4. Beginning with the fiscal year ended March 31, 2006, equity in earnings (losses) of affiliates has been included in income (loss) before income taxes and minority interest. Prior-period data
for the fiscal years ended from March 31, 2005 has been reclassified to conform with the current classification.
For the years ended March 31, 2006 and 2005
¥3,382,143
2,961,363
6,343,506
240,610
178,177
78,186
4,727,113
1,002,165
338,800
372,447
8.6
1.7
¥24.32
22.44
6.50
172
¥3,259,853
2,576,286
5,836,139
154,807
111,232
46,041
4,571,412
815,507
318,394
348,010
5.9
1.0
¥14.32
13.53
5.00
165
3.8
14.9
8.7
55.4
60.2
69.8
3.4
22.9
6.4
7.0
–
–
69.8
65.9
30
4.2
$28,907,205
25,310,795
54,218,000
2,056,496
1,522,880
668,256
40,402,675
8,565,513
2,895,726
3,183,308
–
–
$0.21
0.19
0.06
–