Texas Instruments 2010 Annual Report Download - page 10
Download and view the complete annual report
Please find page 10 of the 2010 Texas Instruments annual report below. You can navigate through the pages in the report by either clicking on the pages listed below, or by using the keyword search tool below to find specific information within the annual report.
TEXAS INSTRUMENTS 2010 ANNUAL REPORT
8
| |
We determine the amount and timing of royalty revenue based on our contractual agreements with intellectual property licensees.
We recognize royalty revenue when earned under the terms of the agreements and when we consider realization of payment to be
probable. Where royalties are based on a percentage of licensee sales of royalty-bearing products, we recognize royalty revenue by
applying this percentage to our estimate of applicable licensee sales. We base this estimate on historical experience and an analysis of
each licensee’s sales results. Where royalties are based on fixed payment amounts, we recognize royalty revenue ratably over the term
of the royalty agreement. Where warranted, revenue from licensees may be recognized on a cash basis.
We include shipping and handling costs in cost of revenue.
Advertising costs: We expense advertising and other promotional costs as incurred. This expense was $44 million in 2010, $42 million in
2009 and $123 million in 2008.
Income taxes: We account for income taxes using an asset and liability approach. We record the amount of taxes payable or refundable
for the current year and the deferred tax assets and liabilities for future tax consequences of events that have been recognized in the
financial statements or tax returns. We record a valuation allowance when it is more likely than not that some portion or all of the
deferred tax assets will not be realized.
Other assessed taxes: Some transactions require us to collect taxes such as sales, value-added and excise taxes from our customers.
These transactions are presented in our statements of income on a net (excluded from revenue) basis.
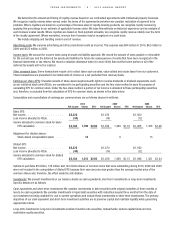
Earnings per share (EPS): Unvested awards of share-based payments with rights to receive dividends or dividend equivalents, such
as our restricted stock units (RSUs), are considered to be participating securities and the two-class method is used for purposes of
calculating EPS for common stock. Under the two-class method, a portion of net income is allocated to these participating securities
and, therefore, is excluded from the calculation of EPS for common stock, as shown in the table below.
Computation and reconciliation of earnings per common share are as follows (shares in millions):
2010 2009 2008
NetIncome Shares EPS NetIncome Shares EPS NetIncome Shares EPS
Basic EPS:
Net income . . . . . . . . . . . . . . . . . . $3,228 $ 1,470 $1,920
Less income allocated to RSUs . . . . . . . . (44) (14) (12)
Income allocated to common stock for basic
EPS calculation . . . . . . . . . . . . . . $ 3,184 1,199 $2.66 $1,456 1,260 $1.16 $1,908 1,308 $1.46
Adjustment for dilutive shares:
Stock-based compensation plans . . . . 14 9 13
Diluted EPS:
Net income . . . . . . . . . . . . . . . . . . $3,228 $ 1,470 $1,920
Less income allocated to RSUs . . . . . . . . (44) (14) (12)
Income allocated to common stock for diluted
EPS calculation . . . . . . . . . . . . . . $ 3,184 1,213 $2.62 $1,456 1,269 $1.15 $1,908 1,321 $1.44
Options to purchase 88 million, 135 million and 123 million shares of common stock that were outstanding during 2010, 2009 and 2008
were not included in the computation of diluted EPS because their exercise price was greater than the average market price of the
common shares and, therefore, the effect would be anti-dilutive.
Investments: We present investments on our balance sheets as cash equivalents, short-term investments or long-term investments.
Specific details are as follows:
Cash equivalents and short-term investments: We consider investments in debt securities with original maturities of three months or
less to be cash equivalents. We consider investments in liquid debt securities with maturities beyond three months from the date of
our investment as being available for use in current operations and include these investments in short-term investments. The primary
objectives of our cash equivalent and short-term investment activities are to preserve capital and maintain liquidity while generating
appropriate returns.
Long-term investments: Long-term investments consist of auction-rate securities, mutual funds, venture capital funds and non-
marketable equity securities.

