Tesco 2003 Annual Report Download - page 33
Download and view the complete annual report
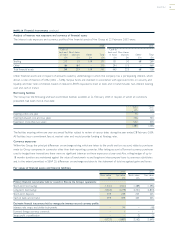
Please find page 33 of the 2003 Tesco annual report below. You can navigate through the pages in the report by either clicking on the pages listed below, or by using the keyword search tool below to find specific information within the annual report.-
 1
1 -
2
-
3
-
4
-
5
-
6
-
7
-
8
-
9
-
10
-
11
-
12
-
13
-
14
-
15
-
16
-
17
-
18
-
19
-
20
-
21
-
22
-
 23
23 -
 24
24 -
 25
25 -
 26
26 -
 27
27 -
 28
28 -
 29
29 -
 30
30 -
 31
31 -
 32
32 -
 33
33 -
 34
34 -
 35
35 -
 36
36 -
 37
37 -
 38
38 -
 39
39 -
 40
40 -
 41
41 -
 42
42 -
 43
43 -
44
-
45
-
46
-
47
-
48
-
49
-
50
-
51
-
52
-
53
-
54
-
55
-
56
-
57
-
58
-
59
-
60
 |
 |

TESCO PLC 31
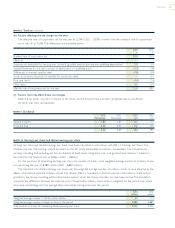
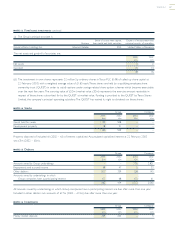
NOTE 3 Employee profit-sharing
This represents the amount allocated to the trustees of the profit-sharing scheme and is based on the UK profit after interest,
before net loss on disposal of fixed assets and taxation.
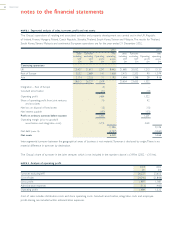
NOTE 4 Profit on ordinary activities before taxation
2003 2002
£m £m
Profit on ordinary activities is stated after charging the following:
Depreciation of tangible fixed assets: 581 524
– owned assets 542 498
– under finance leases 39 26
Goodwill amortisation 23 10
Operating lease costs (a) 172 170
Auditors’ remuneration (b) 11
Employment costs (note 5) 2,653 2,336
(a) Operating lease costs include £39m for hire of plant and machinery (2002 – £33m).
(b) Auditors’ remuneration for audit services amounted to £0.9m (2002 – £0.8m) and includes £0.1m (2002 – £0.1m) for the company.
The auditors also received £1.8m (2002 – £1.2m) in respect of non-audit services of which £1.0m (2002 – £0.4m) related to overseas operations.
The breakdown by category was £0.7m relating to accounting and taxation advice and £1.1m relating to acquisition advice.
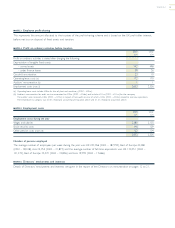
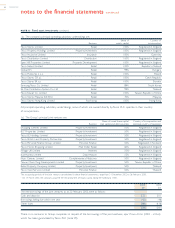
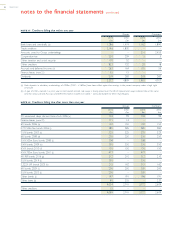
NOTE 5 Employment costs
2003 2002
£m £m
Employment costs during the year
Wages and salaries 2,385 2,103
Social security costs 146 129
Other pension costs (note 26) 122 104
2,653 2,336
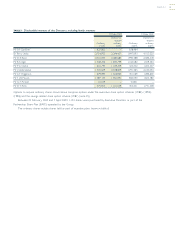
Number of persons employed
The average number of employees per week during the year was: UK 203,766 (2002 – 187,393), Rest of Europe 42,280
(2002 – 38,108), Asia 24,754 (2002 – 21,873) and the average number of full-time equivalents was: UK 133,051 (2002 –
121,272), Rest of Europe 35,372 (2002 – 32,856) and Asia 19,759 (2002 – 17,666).
NOTE 6 Directors’ emoluments and interests
Details of Directors’ emoluments and interests are given in the report of the Directors on remuneration on pages 12 to 21.