Tesco 2002 Annual Report Download - page 42
Download and view the complete annual report
Please find page 42 of the 2002 Tesco annual report below. You can navigate through the pages in the report by either clicking on the pages listed below, or by using the keyword search tool below to find specific information within the annual report.-
 1
1 -
2
-
3
-
4
-
5
-
6
-
7
-
8
-
9
-
10
-
11
-
12
-
13
-
14
-
15
-
16
-
17
-
18
-
19
-
20
-
21
-
22
-
23
-
24
-
25
-
26
-
27
-
28
-
29
-
30
-
31
-
 32
32 -
 33
33 -
 34
34 -
 35
35 -
 36
36 -
 37
37 -
 38
38 -
 39
39 -
 40
40 -
 41
41 -
 42
42 -
 43
43 -
 44
44
 |
 |

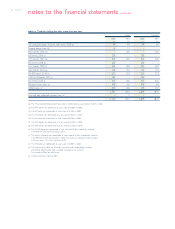
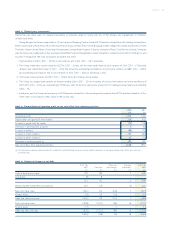
40 TESCO PLC
Year ended February 199811999 2000 2001 2002
Restated
Financial statistics £m
Group sales 17,779 18,546 20,358 22,773 25,654
Turnover excluding VAT
UK 14,971 15,835 16,958 18,372 20,052
Rest of Europe 1,481 1,167 1,374 1,756 2,203
Asia – 156 464 860 1,398
16,452 17,158 18,796 20,988 23,653
Underlying operating profit 2
UK 875 919 993 1,100 1,213
Rest of Europe 37 48 51 70 90
Asia – (2) (1) 4 29
912 965 1,043 1,174 1,332
Operating margin 2
UK 5.8% 5.8% 5.9% 6.0% 6.0%
Rest of Europe 2.5% 4.1% 3.7% 4.0% 4.1%
Asia – (1.3)% (0.2)% 0.5% 2.1%
Total Group 5.5% 5.6% 5.5% 5.6% 5.6%
Share of profit /(loss) from joint ventures
and associates (6) 6 11 21 42
Net interest payable (74) (90) (99) (125) (153)
Underlying pre-tax profit 3832 881 955 1,070 1,221
Ireland integration costs (63) (26) (6) – –
Goodwill amortisation – (5) (7) (8) (10)
Net loss on disposal of discontinued operations 4(8)––––
Net loss on disposal of fixed assets (1) (8) (9) (8) (10)
Profit on ordinary activities before taxation 760 842 933 1,054 1,201
Taxation 13 (228) (237) (259) (333) (371)
Minority interests –1–1–
Profit for the financial year 13 532 606 674 722 830
Group enterprise value 512,556 13,528 13,591 21,590 21,290
Adjusted diluted earnings per share 3/13 8.84p 9.37p 10.18p 10.66p 12.14p
Adjusted earnings per share 3/13 9.05p 9.59p 10.36p 10.87p 12.33p
Dividend per share 3.87p 4.12p 4.48p 4.98p 5.60p
Return on shareholders’ funds 6/13 21.3% 21.3% 20.9% 22.7% 23.2%
Return on capital employed 7/13 18.7% 17.2% 16.1% 16.6% 16.1%
Group statistics
Number of stores 781 821 845 907 979
Total sales area – 000 sq ft 18,254 21,353 24,039 28,362 32,491
Full-time equivalent employees 119,127 126,914 134,896 152,210 171,794
UK retail statistics
Number of stores 618 639 659 692 729
Total sales area – 000 sq ft 815,215 15,975 16,895 17,965 18,822
Average store size (sales area – sq ft) 925,490 25,627 26,641 27,636 28,576
Full-time equivalent employees 10 99,941 104,772 108,409 113,998 121,272
UK retail productivity £
Turnover per employee 11 149,799 151,138 156,427 161,161 165,348
Profit per employee 11 8,755 8,771 9,160 9,649 10,002
Wages per employee 11 15,079 15,271 15,600 16,087 16,821
Weekly sales per sq ft 12/8 20.48 21.05 21.43 22.01 22.33
notes
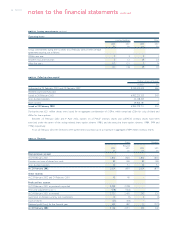
1 53 week period.
2 Excludes integration costs and goodwill
amortisation. Operating margin is
based upon turnover exclusive of VAT.
3 Underlying profit, adjusted and
adjusted diluted, earnings per share
exclude net loss on disposal of fixed
assets, loss on disposal of discontinued
operations, Ireland integration costs
and goodwill amortisation.
4 Represents loss on disposal
of discontinued operations.
5 Market capitalisation plus net debt.
6 Underlying profit divided by average
shareholders’ funds.
7 Profit divided by average capital
employed excluding net debt.
8 Store sizes exclude lobby and
restaurant areas.
9 Average store size excludes
Express stores.
10 Based on average number of full-
time equivalent employees in the UK.
11 Based on turnover exclusive of VAT,
operating profit and total staff cost
per full-time equivalent employee.
12 Based on weighted average sales
area and sales excluding property
development.
13 2002 and 2001 statistics have been
calculated based on the adoption of
FRS 19, ‘Deferred Tax’. See note 1
on page 22.
five year record