Tesco 2002 Annual Report Download - page 3
Download and view the complete annual report
Please find page 3 of the 2002 Tesco annual report below. You can navigate through the pages in the report by either clicking on the pages listed below, or by using the keyword search tool below to find specific information within the annual report.-
 1
1 -
 2
2 -
 3
3 -
 4
4 -
 5
5 -
 6
6 -
 7
7 -
 8
8 -
 9
9 -
 10
10 -
 11
11 -
 12
12 -
 13
13 -
 14
14 -
15
-
16
-
17
-
18
-
19
-
20
-
21
-
22
-
23
-
24
-
25
-
26
-
27
-
28
-
29
-
30
-
31
-
32
-
33
-
34
-
35
-
36
-
37
-
38
-
39
-
40
-
41
-
42
-
43
-
44
 |
 |

TESCO PLC 1
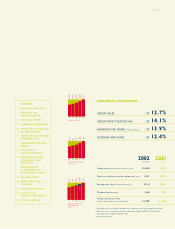
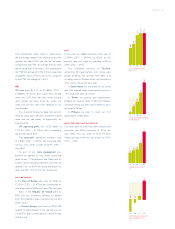
GROUP SALES UP 12.7%
GROUP PROFIT BEFORE TAX†UP 14.1%
EARNINGS PER SHARE† (adjusted diluted) UP 13.9%
DIVIDEND PER SHARE UP 12.4%
FINANCIAL HIGHLIGHTS
2002 2001
52 weeks 52 weeks
Group sales (including value added tax) (£m) 25,654 22,773
Profit on ordinary activities before tax†(£m) 1,221 1,070
Earnings per share†(adjusted diluted) (p) 12.14 10.66‡
Dividend per share (p) 5.60 4.98
Group enterprise value
(market capitalisation plus net debt) (£m) 21,290 21,590
†Excluding net loss on disposal of fixed assets, integration costs and goodwill amortisation.
‡Restated due to the adoption of Financial Reporting Standard (FRS) 19, ‘Deferred Tax’.
‡‡ Excluding impact of FRS 19, ‘Deferred Tax’.
* 52 weeks pro forma.
CONTENTS
1FINANCIAL HIGHLIGHTS
2OPERATING AND
FINANCIAL REVIEW
5DIRECTORS’ REPORT
7CORPORATE GOVERNANCE
10 REPORT OF THE DIRECTORS
ON REMUNERATION
15 STATEMENT OF DIRECTORS’
RESPONSIBILITIES
INDEPENDENT AUDITORS’
REPORT
16 GROUP PROFIT
AND LOSS ACCOUNT
17 STATEMENT OF TOTAL
RECOGNISED GAINS
AND LOSSES
RECONCILIATION
OF MOVEMENTS IN
SHAREHOLDERS’ FUNDS
18 BALANCE SHEETS
19 GROUP CASH FLOW
STATEMENT
20 ACCOUNTING POLICIES
22 NOTES TO THE
FINANCIAL STATEMENTS
40 FIVE YEAR RECORD
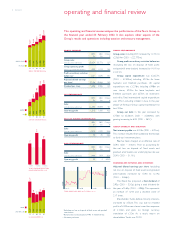
17,447*
18,546
20,358
22,773
25,654
GROUP SALES £m
98 99 00 01 02
98 99 00 0201
GROUP PROFIT BEFORE
TAX † £m
817*
881
955
1,070
1,221
98 99 00 0201
EARNINGS PER SHARE
pence
(adjusted diluted)
8.70*
9.37
10.18
11.31‡‡
10.66‡
12.14