Tesco 2000 Annual Report Download - page 35
Download and view the complete annual report
Please find page 35 of the 2000 Tesco annual report below. You can navigate through the pages in the report by either clicking on the pages listed below, or by using the keyword search tool below to find specific information within the annual report.-
 1
1 -
2
-
3
-
4
-
5
-
6
-
7
-
8
-
9
-
10
-
11
-
12
-
13
-
14
-
15
-
16
-
17
-
18
-
19
-
20
-
21
-
22
-
23
-
24
-
 25
25 -
 26
26 -
 27
27 -
 28
28 -
 29
29 -
 30
30 -
 31
31 -
 32
32 -
 33
33 -
 34
34 -
 35
35 -
 36
36 -
 37
37 -
 38
38 -
 39
39 -
 40
40 -
 41
41 -
 42
42 -
 43
43 -
 44
44
 |
 |

TESCO PLC
33
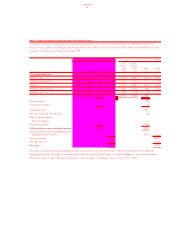
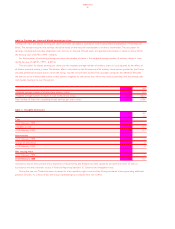
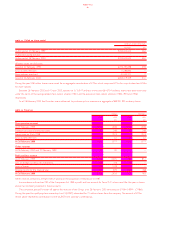
NOTE 20 Financial instruments continued
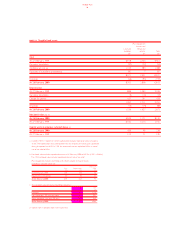
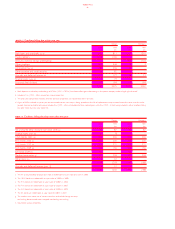
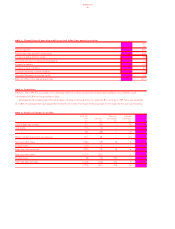
Analysis of interest rate exposure and currency of financial assets
The interest rate exposure and currency profile of the financial assets of the Group at 26 February 2000 were:
Cash at Cash at
bank and Short-term 2000 bank and Short-term 1999
in hand deposits Other Total in hand deposits Other Total
£m £m £m £m £m £m £m £m
Sterling – 75 37 112 62 49 20 131
Other 88 183 – 271 65 152 – 217
Total financial assets 88 258 37 383 127 201 20 348
Other financial assets are in respect of amounts owed by undertakings in which the company has a participating interest, which attracts a rate
of interest of 6.7%. Surplus funds are invested in accordance with approved limits on security and liquidity and bear rates of interest based on
relevant LIBOR equivalents. Cash at bank and in hand includes non interest bearing cash and cash in transit.
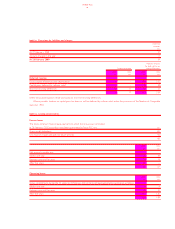
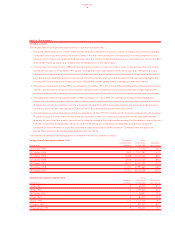
Currency exposures
Within the Group, the principal differences on exchange arising which are taken to the profit and loss account, relate to purchases made
by Group companies in currencies other than their reporting currencies. After taking into account hedging transactions, there were no
significant balances on these exposures at year end. Rolling hedges of up to one year’s duration are maintained against the value of
investments and long-term intercompany borrowings in overseas subsidiaries, and to the extent permitted in SSAP20, differences on
exchange are taken to the statement of total recognised gains and losses.
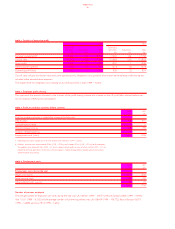
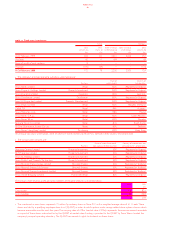
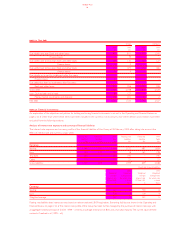
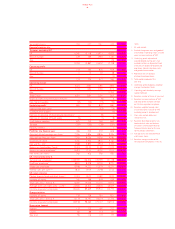
Fair values of financial assets and financial liabilities
2000 1999
Book value Fair value Book value Fair value
£m £m £m £m
Primary financial instruments held or issued to finance the Group’s operations:
Short-term borrowings (847) (847) (830) (830)
Long-term borrowings (1,559) (1,563) (1,218) (1,335)
Short-term deposits 258 258 201 201
Cash at bank and in hand 88 88 127 127
Derivative financial instruments held to manage the interest rate and currency profile:
Interest rate swaps and similar instruments – 4 – 24
Forward foreign currency contracts (9) (9) (4) (4)
Swap profit crystallisation (12) (12) (18) (18)
(2,081) (2,081) (1,742) (1,835)
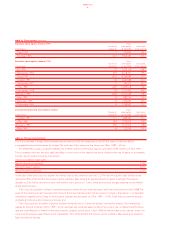
Other significant financial instruments outstanding at the year end are £44m (1999 – £222m) nominal value forward foreign exchange contracts
hedging the cost of foreign currency denominated purchases. On a mark-to-market basis, these contracts show a profit of nil (1999 – nil).
The fair values of the interest rate swaps, forward foreign currency contracts and long-term sterling denominated fixed rate debt have been
determined by reference to prices available from the markets on which the instruments are traded. The fair values of all other items have been
calculated by discounting expected future cash flows at prevailing interest rates.
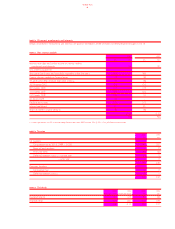
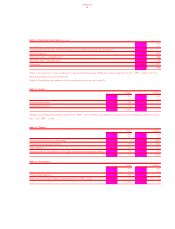
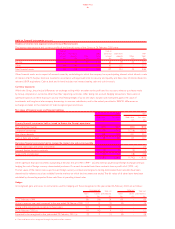
Hedges
Unrecognised gains and losses on instruments used for hedging and those recognised in the year ended 26 February 2000 are as follows:
Unrecognised Total net Deferred Total net
Gains Losses gains/(losses) Gains Losses gains/(losses)
£m £m £m £m £m £m
At 27 February 1999 58 (34) 24 18 – 18
Arising in previous years and recognised in the year ended 26 February 2000 (17) 15 (2) (6) – (6)
Arising in the period to be recognised in future years (27) 9 (18) – – –
At 26 February 2000 (a) 14 (10) 4 12 – 12
Expected to be recognised in the year ended 24 February 2001 (a) (3) 2 (1) (6) – (6)
aGains and losses to be recognised through the profit and loss account.