Tesco 2000 Annual Report Download - page 3
Download and view the complete annual report
Please find page 3 of the 2000 Tesco annual report below. You can navigate through the pages in the report by either clicking on the pages listed below, or by using the keyword search tool below to find specific information within the annual report.-
 1
1 -
 2
2 -
 3
3 -
 4
4 -
 5
5 -
 6
6 -
 7
7 -
 8
8 -
 9
9 -
 10
10 -
 11
11 -
 12
12 -
 13
13 -
 14
14 -
15
-
16
-
17
-
18
-
19
-
20
-
21
-
22
-
23
-
24
-
25
-
26
-
27
-
28
-
29
-
30
-
31
-
32
-
33
-
34
-
35
-
36
-
37
-
38
-
39
-
40
-
41
-
42
-
43
-
44
 |
 |
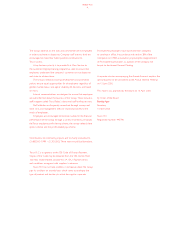
TESCO PLC
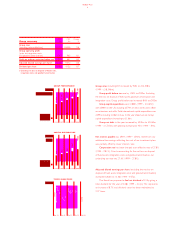
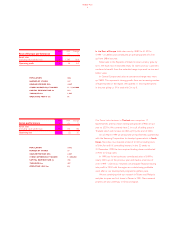
1
1998*
2000 1999 52 weeks
52 weeks 52 weeks (pro forma)
Group sales (including value added tax) (£m) 20,358 18,546 17,447
Group operating profit
(prior to integration costs
and goodwill amortisation) (£m) 1,043 965 895
Profit on ordinary activities
before tax † (£m) 955 881 817
Group enterprise value
(market capitalisation plus net debt) (£m) 13,591 13,528 12,556
Adjusted diluted earnings per share †(p) 10.18 9.37 8.70
Dividend per share (p) 4.48 4.12 3.87
Number of stores 845 821 781
Retail selling area (000 sq ft)24,039 21,353 18,254
†Excluding net loss on disposal of fixed assets, net loss on disposal of discontinued operations,
integration costs and goodwill amortisation.
‡Adjusted diluted.
*1998 was a 53 week year. For comparison purposes a pro forma 52 week profit and loss account
has been used.
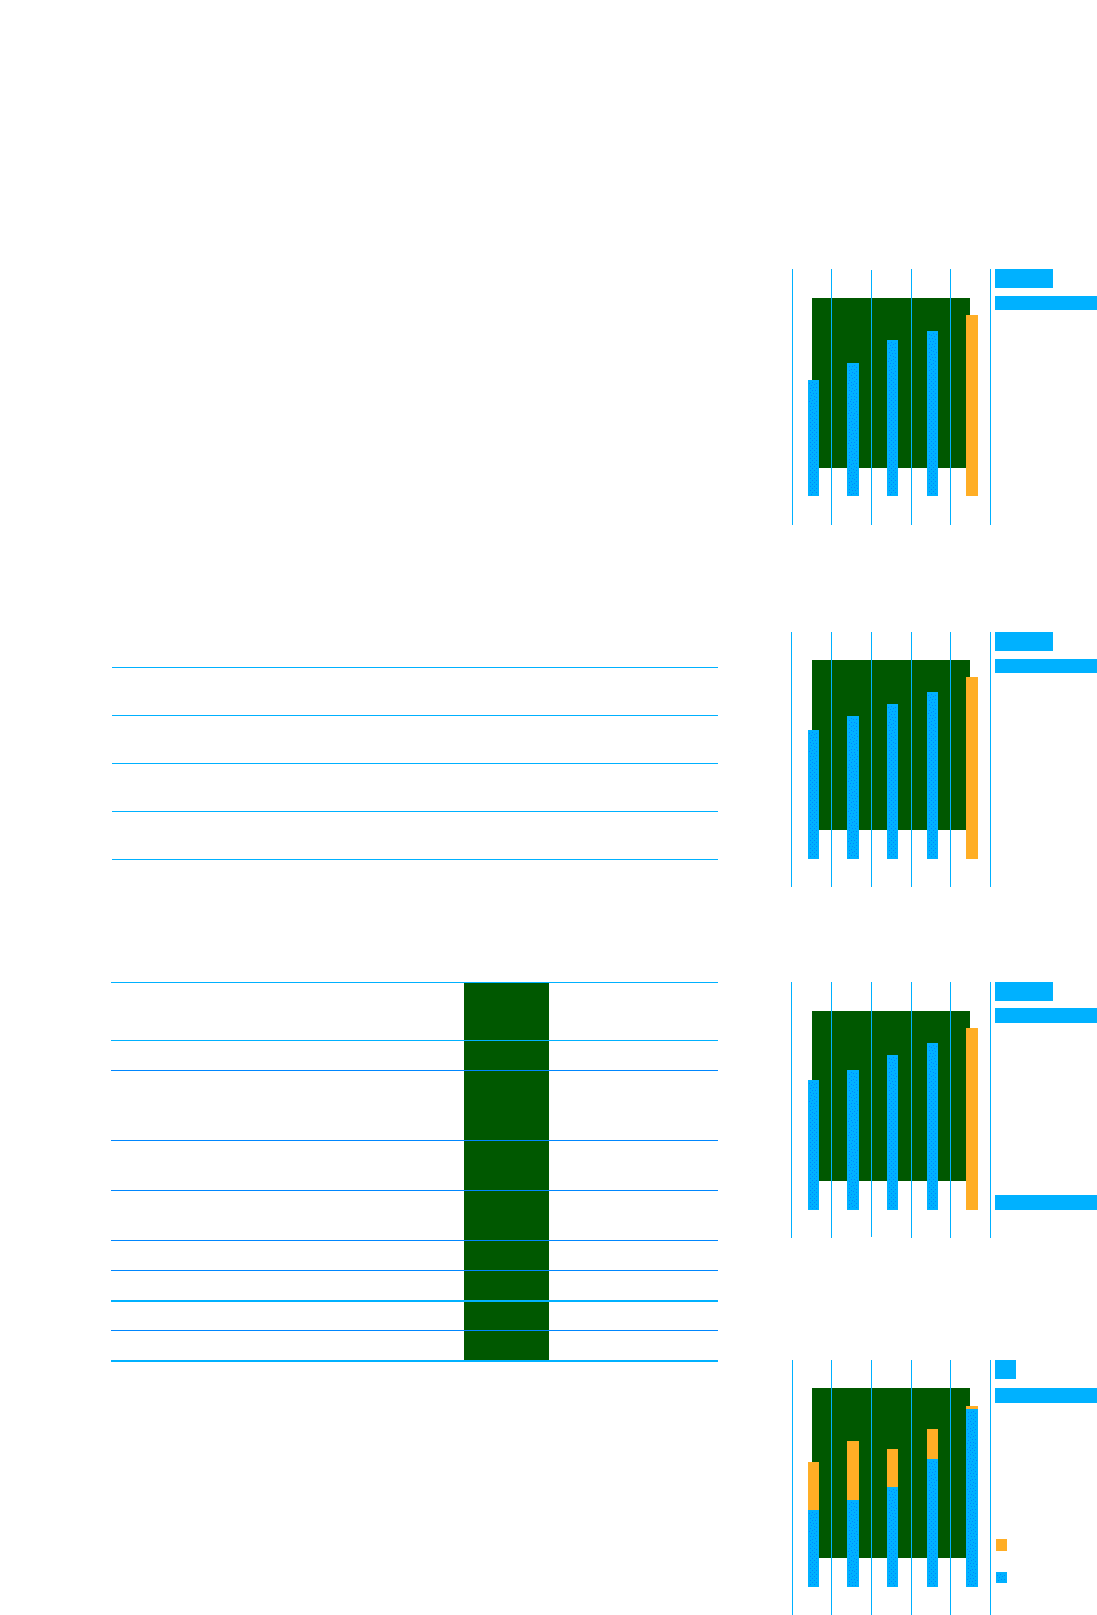
Group sales up 9.8%
Group profit before tax†up 8.4%
Earnings per share† ‡ up 8.6%
Dividend per share up 8.7%
financial highlights
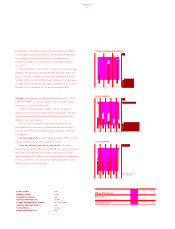
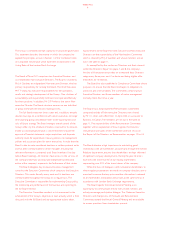
1996 1997 1998 1999 2000
1,046
1,219
1,156
1,321
1,513
£m
operating cash flow
capital expenditure
OPERATING CASH FLOW
AND CAPITAL EXPENDITURE
1996 1997 1998 1999 2000
7.30
7.83
8.70*
9.37
10.18
Pence
(before integration costs,
goodwill amortisation
and net loss on disposal
of fixed assets)
EARNINGS PER SHARE
1996 1997 1998 1999 2000
681
750
817*
881
955
£m
GROUP PROFIT BEFORE TAX
1996 1997 1998 1999 2000
13,028
14,984
17,447*
18,546
20,358
£m
GROUP SALES
*52 weeks pro forma
*52 weeks pro forma
*52 weeks pro forma
(adjusted diluted)
1,488
1,067
841
758
666