Tesco 2000 Annual Report Download - page 27
Download and view the complete annual report
Please find page 27 of the 2000 Tesco annual report below. You can navigate through the pages in the report by either clicking on the pages listed below, or by using the keyword search tool below to find specific information within the annual report.-
 1
1 -
2
-
3
-
4
-
5
-
6
-
7
-
8
-
9
-
10
-
11
-
12
-
13
-
14
-
15
-
16
-
 17
17 -
 18
18 -
 19
19 -
 20
20 -
 21
21 -
 22
22 -
 23
23 -
 24
24 -
 25
25 -
 26
26 -
 27
27 -
 28
28 -
 29
29 -
 30
30 -
 31
31 -
 32
32 -
 33
33 -
 34
34 -
 35
35 -
 36
36 -
 37
37 -
38
-
39
-
40
-
41
-
42
-
43
-
44
 |
 |

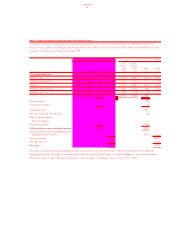
TESCO PLC
25
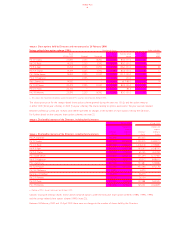
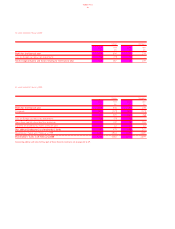
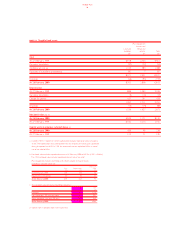
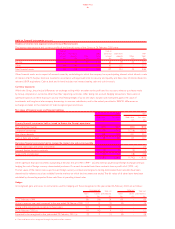
NOTE 2 Analysis of operating profit
2000 1999
Continuing Continuing
operations Acquisitions Total operations Acquisitions Total
£m £m £m £m £m £m
Turnover excluding VAT 18,666 130 18,796 17,002 156 17,158
Cost of sales (17,242) (123) (17,365) (15,695) (155) (15,850)
Gross profit 1,424 7 1,431 1,307 1 1,308
Administration expenses (394) (7) (401) (371) (3) (374)
Operating profit/(loss) 1,030 – 1,030 936 (2) 934
Cost of sales includes distribution costs and store operating costs. Integration costs, goodwill amortisation and employee profit-sharing are
included within administration expenses.
The charge made for integration costs relating to our Irish businesses is £6m (1999 – £26m).
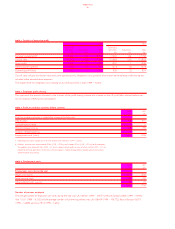
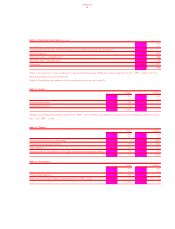
NOTE 3 Employee profit-sharing
This represents the amount allocated to the trustees of the profit-sharing scheme and is based on the UK profit after interest, before net
loss on disposal of fixed assets and taxation.
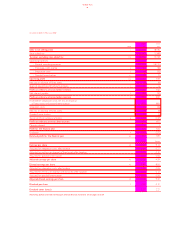
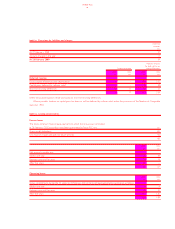
NOTE 4 Profit on ordinary activities before taxation
2000 1999
£m £m
Profit on ordinary activities is stated after charging the following:
Depreciation 428 401
Goodwill amortisation 75
Operating lease costs (a) 158 159
Auditors’ remuneration (b) 11
Employment costs (note 5) 1,865 1,736
a Operating lease costs include £37m for hire of plant and machinery (1999 – £35m).
b Auditors’ remuneration amounted to £0.8m (1999 – £0.7m) and includes £0.1m (1999 – £0.1m) for the company.
The auditors also received £3.6m (1999 – £1.9m) in respect of non-audit services of which £2.0m (1999 – £1.1m)
related to overseas operations. These fees were principally in respect of acquisitions, taxation advice and systems
implementation and training.
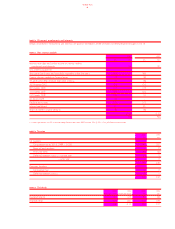
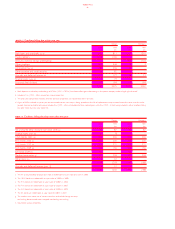
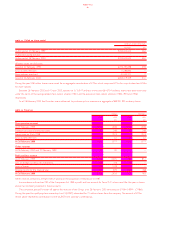
NOTE 5 Employment costs
2000 1999
£m £m
Employment costs during the year
Wages and salaries 1,677 1,558
Social security costs 106 105
Other pension costs (note 26) 82 73
1,865 1,736
Number of persons employed
The average number of employees per week during the year was: UK 169,500 (1999 – 164,471), Rest of Europe 24,665 (1999 – 19,497),
Asia 11,051 (1999 – 6,133) and the average number of full-time equivalents was: UK 108,409 (1999 – 104,772), Rest of Europe 18,573
(1999 – 16,489) and Asia 7,914 (1999 – 5,653).