Telstra 2007 Annual Report Download - page 18
Download and view the complete annual report
Please find page 18 of the 2007 Telstra annual report below. You can navigate through the pages in the report by either clicking on the pages listed below, or by using the keyword search tool below to find specific information within the annual report.-
 1
1 -
2
-
3
-
4
-
5
-
6
-
7
-
 8
8 -
 9
9 -
 10
10 -
 11
11 -
 12
12 -
 13
13 -
 14
14 -
 15
15 -
 16
16 -
 17
17 -
 18
18 -
 19
19 -
 20
20 -
 21
21 -
 22
22 -
 23
23 -
 24
24 -
 25
25 -
 26
26 -
 27
27 -
 28
28 -
29
-
30
-
31
-
32
-
33
-
34
-
35
-
36
-
37
-
38
-
39
-
40
-
41
-
42
-
43
-
44
-
45
-
46
-
47
-
48
-
49
-
50
-
51
-
52
-
53
-
54
-
55
-
56
-
57
-
58
-
59
-
60
-
61
-
62
-
63
-
64
-
65
-
66
-
67
-
68
-
69
-
70
-
71
-
72
-
73
-
74
-
75
-
76
-
77
-
78
-
79
-
80
-
81
-
82
-
83
-
84
-
85
-
86
-
87
-
88
-
89
-
90
-
91
-
92
-
93
-
94
-
95
-
96
-
97
-
98
-
99
-
100
-
101
-
102
-
103
-
104
-
105
-
106
-
107
-
108
-
109
-
110
-
111
-
112
-
113
-
114
-
115
-
116
-
117
-
118
-
119
-
120
-
121
-
122
-
123
-
124
-
125
-
126
-
127
-
128
-
129
-
130
-
131
-
132
-
133
-
134
-
135
-
136
-
137
-
138
-
139
-
140
-
141
-
142
-
143
-
144
-
145
-
146
-
147
-
148
-
149
-
150
-
151
-
152
-
153
-
154
-
155
-
156
-
157
-
158
-
159
-
160
-
161
-
162
-
163
-
164
-
165
-
166
-
167
-
168
-
169
-
170
-
171
-
172
-
173
-
174
-
175
-
176
-
177
-
178
-
179
-
180
-
181
-
182
-
183
-
184
-
185
-
186
-
187
-
188
-
189
-
190
-
191
-
192
-
193
-
194
-
195
-
196
-
197
-
198
-
199
-
200
-
201
-
202
-
203
-
204
-
205
-
206
-
207
-
208
-
209
-
210
-
211
-
212
-
213
-
214
-
215
-
216
-
217
-
218
-
219
-
220
-
221
-
222
-
223
-
224
-
225
-
226
-
227
-
228
-
229
-
230
-
231
-
232
-
233
-
234
-
235
-
236
-
237
-
238
-
239
-
240
-
241
-
242
-
243
-
244
-
245
-
246
-
247
-
248
-
249
-
250
-
251
-
252
-
253
-
254
-
255
-
256
-
257
-
258
-
259
-
260
-
261
-
262
-
263
-
264
-
265
-
266
-
267
-
268
-
269
 |
 |

15
Telstra Corporation Limited and controlled entities
Full year results and operations review - June 2007
International direct calls
Our operating revenue from international direct relates to revenue we generate from international calls
made from Australia to a destination outside Australia (outbound). This revenue is largely driven by
international events, customer perceptions about the cost and value of our service, competition, migration
to broadband alternatives, promotion and advertising, and general economic conditions.
Our international direct revenue declined by 8.5% to $184 million primarily as a result of continued
competitive pressure on price and lower volumes, despite improving from a decline of 14.1% in fiscal 2006.
Factors which have influenced this trend include the competitive pressures from calling cards, increased use
of emails, fixed to mobile substitution and the growth of Voice over IP in the market place. International
direct minutes declined by only 1.1% for the fiscal year. Despite increases in flagfall rates, our international
direct revenue per minute still experienced a reduction as a result of the factors discussed above, as well as
the growth of subscription plans offering cheaper capped international calls.
Fixed interconnection
Fixed interconnection is made up of local and non local PSTN/ISDN access interconnection services provided
to other carriers and Global Linx, a Telstra Wholesale international voice call product. This category is a
highly regulated area of the Australian telecommunications market.
Our operating revenue from fixed interconnection decreased by 10.7% to $276 million driven mainly by a
reduction in volumes whilst yield remains consistent year on year. Volume declines are in line with cross
company trends in PSTN traffic and have been particularly impacted by migration to mobiles and, to a small
degree, ULL build.
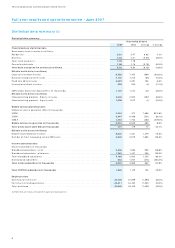
ISDN products
ISDN is a flexible, switched network based on digital technology. It can support several applications at one
time (such as voice, data and video) while using a single access point to the network. ISDN services are
offered to residential and business customers across Australia. Our ISDN products revenue is impacted by
offerings and packages in the broadband market, growth in the number of DSL enabled exchanges and
migration to advanced data products such as IP solutions in the business markets.
ISDN access revenue has increased marginally by 0.5% to $419 million. ISDN 2 access has improved by 4.1%
to $183 million due to reduced discounting offset by the impact of broadband promotion and growth in DSL
enabled exchanges. ISDN 10/20/30 declined by 2.2% to $237 million as a result of yield reduction associated
with the acquisition of new services and whole of business deals.
ISDN data calls revenue decreased by 23.7% to $90 million as local and national long distance calls
decreased by $20 million and $8 million respectively. This result is due to lower minutes of use as a result of
ISDN products
Year ended 30 June
2007 2006 Change 2007/2006
$m $m $m (% change)
Access revenue . . . . . . . . . . . . . . . . . . . . . . . . . . . . . . . . . . . . . . . . . . . . . . . 419 417 2 0.5%
Data calls . . . . . . . . . . . . . . . . . . . . . . . . . . . . . . . . . . . . . . . . . . . . . . . . . . 90 118 (28) (23.7%)
Voice calls . . . . . . . . . . . . . . . . . . . . . . . . . . . . . . . . . . . . . . . . . . . . . . . . . . 240 271 (31) (11.4%)
Total calls revenue . . . . . . . . . . . . . . . . . . . . . . . . . . . . . . . . . . . . . . . . . . . . 330 389 (59) (15.2%)
Total ISDN products revenue . . . . . . . . . . . . . . . . . . . . . . . . . . . . . . . . . . . . . . 749 806 (57) (7.1%)
Average revenue per user per month $'s . . . . . . . . . . . . . . . . . . . . . . . . . . . . . . . 224.99 229.46 (4.47) (1.9%)
ISDN access lines (basic access line equivalents) (in thousands) (i) . . . . . . . . . . . . . . . 1,172 1,214 (42) (3.5%)
Note: statistical data represents management's best estimates.