Telstra 2007 Annual Report Download - page 15
Download and view the complete annual report
Please find page 15 of the 2007 Telstra annual report below. You can navigate through the pages in the report by either clicking on the pages listed below, or by using the keyword search tool below to find specific information within the annual report.-
 1
1 -
2
-
3
-
4
-
 5
5 -
 6
6 -
 7
7 -
 8
8 -
 9
9 -
 10
10 -
 11
11 -
 12
12 -
 13
13 -
 14
14 -
 15
15 -
 16
16 -
 17
17 -
 18
18 -
 19
19 -
 20
20 -
 21
21 -
 22
22 -
 23
23 -
 24
24 -
 25
25 -
26
-
27
-
28
-
29
-
30
-
31
-
32
-
33
-
34
-
35
-
36
-
37
-
38
-
39
-
40
-
41
-
42
-
43
-
44
-
45
-
46
-
47
-
48
-
49
-
50
-
51
-
52
-
53
-
54
-
55
-
56
-
57
-
58
-
59
-
60
-
61
-
62
-
63
-
64
-
65
-
66
-
67
-
68
-
69
-
70
-
71
-
72
-
73
-
74
-
75
-
76
-
77
-
78
-
79
-
80
-
81
-
82
-
83
-
84
-
85
-
86
-
87
-
88
-
89
-
90
-
91
-
92
-
93
-
94
-
95
-
96
-
97
-
98
-
99
-
100
-
101
-
102
-
103
-
104
-
105
-
106
-
107
-
108
-
109
-
110
-
111
-
112
-
113
-
114
-
115
-
116
-
117
-
118
-
119
-
120
-
121
-
122
-
123
-
124
-
125
-
126
-
127
-
128
-
129
-
130
-
131
-
132
-
133
-
134
-
135
-
136
-
137
-
138
-
139
-
140
-
141
-
142
-
143
-
144
-
145
-
146
-
147
-
148
-
149
-
150
-
151
-
152
-
153
-
154
-
155
-
156
-
157
-
158
-
159
-
160
-
161
-
162
-
163
-
164
-
165
-
166
-
167
-
168
-
169
-
170
-
171
-
172
-
173
-
174
-
175
-
176
-
177
-
178
-
179
-
180
-
181
-
182
-
183
-
184
-
185
-
186
-
187
-
188
-
189
-
190
-
191
-
192
-
193
-
194
-
195
-
196
-
197
-
198
-
199
-
200
-
201
-
202
-
203
-
204
-
205
-
206
-
207
-
208
-
209
-
210
-
211
-
212
-
213
-
214
-
215
-
216
-
217
-
218
-
219
-
220
-
221
-
222
-
223
-
224
-
225
-
226
-
227
-
228
-
229
-
230
-
231
-
232
-
233
-
234
-
235
-
236
-
237
-
238
-
239
-
240
-
241
-
242
-
243
-
244
-
245
-
246
-
247
-
248
-
249
-
250
-
251
-
252
-
253
-
254
-
255
-
256
-
257
-
258
-
259
-
260
-
261
-
262
-
263
-
264
-
265
-
266
-
267
-
268
-
269
 |
 |

12
Telstra Corporation Limited and controlled entities
Full year results and operations review - June 2007
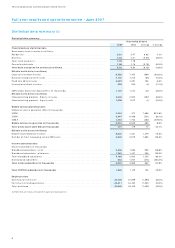
Total PSTN products revenue declined by 4.1% to $7,190 million during fiscal 2007. This decline has slowed
when compared wit h t he 6.8% decline in fiscal 2006. In t he second half of fiscal 2007, our PSTN revenue only
declined by 2.5% compared with the prior corresponding period, showing a significant improvement on the
first half year decline of 5.6%. In particular, total retail access lines in service stopped declining and held
steady for the first time since fiscal 2001.
During the second half of fiscal 2006, we introduced subscription pricing plans for our PSTN customers,
which offer greater choice and value from the home phone, including untimed national long distance calls
and low or no charge local calls. Overall, these plans have impacted positively on our PSTN revenue
performance for the current fiscal year, as evidenced by the significantly slowed decline in PSTN revenue
and the number of retail access lines holding steady. We have also introduced market based management
initiatives which focused on targeting individual customer segments and understanding their unique needs.
Such initiatives, together with subscription based plans and an increase in multi-product holding numbers
during the fiscal year, have contributed positively to our PSTN revenue performance. Notably, the decline
in fixed to mobile revenue was contained at 0.2%, compared with a decline of 4.9% during the prior
corresponding period. Our PSTN retail churn has also turned positive in fiscal 2007.
Challenges still exist in the PSTN market. With the exception of fixed to mobile minutes, there has been a
general reduction in PSTN volumes. There was also a decline in total basic access lines for the fiscal year,
although the retail lines held steady. Volumes have reduced across local calls, national long distance calls,
international direct calls and fixed interconnection. Yields have also declined in local calls, national long
distance calls, fixed to mobile calls and international direct calls due to competitive pricing pressure, higher
demand for alternative products, as well as the impact of newly introduced subscription pricing plans on
certain categories as discussed below.
Basic access
Our basic access revenue includes monthly rental fees, installation charges and connection charges, from
telephone service connections between a customer's premises and our PSTN network.
Basic access revenues are affected by:
• demand for telephone services and additional lines;
• competition;
• regulatory constraints in relation to wholesale basic access;
• migration to other products such as broadband and mobiles;
• housing growth; and
• price changes.
Under our basic access pricing structure, we have a range of access and call pricing packages to give our
residential and business customers choice in the plan they select, along with a range of reward options.
These pricing packages are reviewed regularly to reflect the changing needs of customers. For the most part,
wholesale customers receive the pricing plan which only incorporates the basic telephone service with local
call rates, excluding long distance and fixed to mobile calls (with a "residential" and "business"
differentiation still applying).
Our revenue from basic access services has increased slightly by 0.5% to $3,333 million, an improvement
from a decline of 1.3% in fiscal 2006. Retail basic access lines have remained at the same level seen in the
prior fiscal year, which is a considerable improvement from a decline of 3.4% in fiscal 2006. Retail churn
results are positive at the end of fiscal 2007 and we have experienced positive retail churn since October
2006. Despite strong competition and migration to alternative products such as ULL (unconditioned local
loop), broadband and mobiles, our number of residential access lines actually increased by 1.1%. Our
business basic access lines decreased slightly by 2.6%. The loss of access lines in service came from the
Wholesale business, which has declined by 8.3%, compared with growth of 4.3% in fiscal 2006, highlighting
the churn impact between our retail and wholesale businesses and the impact of ULL. As a result, our total
basic access lines declined by 1.8%.