Tech Data 2013 Annual Report Download - page 17
Download and view the complete annual report
Please find page 17 of the 2013 Tech Data annual report below. You can navigate through the pages in the report by either clicking on the pages listed below, or by using the keyword search tool below to find specific information within the annual report.-
 1
1 -
2
-
3
-
4
-
5
-
6
-
 7
7 -
 8
8 -
 9
9 -
 10
10 -
 11
11 -
 12
12 -
 13
13 -
 14
14 -
 15
15 -
 16
16 -
 17
17 -
 18
18 -
 19
19 -
 20
20 -
 21
21 -
 22
22 -
 23
23 -
 24
24 -
 25
25 -
 26
26 -
 27
27 -
28
-
29
-
30
-
31
-
32
-
33
-
34
-
35
-
36
-
37
-
38
-
39
-
40
-
41
-
42
-
43
-
44
-
45
-
46
-
47
-
48
-
49
-
50
-
51
-
52
-
53
-
54
-
55
-
56
-
57
-
58
-
59
-
60
-
61
-
62
-
63
-
64
-
65
-
66
-
67
-
68
-
69
-
70
-
71
-
72
-
73
-
74
-
75
-
76
-
77
-
78
-
79
-
80
-
81
-
82
-
83
-
84
-
85
-
86
-
87
-
88
-
89
-
90
-
91
-
92
-
93
-
94
-
95
-
96
-
97
-
98
-
99
-
100
-
101
-
102
-
103
-
104
-
105
-
106
-
107
-
108
-
109
-
110
-
111
-
112
-
113
-
114
-
115
-
116
-
117
-
118
-
119
-
120
-
121
-
122
-
123
-
124
-
125
-
126
-
127
-
128
-
129
-
130
-
131
-
132
-
133
-
134
-
135
-
136
-
137
-
138
-
139
-
140
-
141
-
142
-
143
-
144
-
145
-
146
-
147
-
148
-
149
-
150
-
151
-
152
-
153
-
154
-
155
-
156
-
157
-
158
-
159
-
160
-
161
-
162
-
163
-
164
-
165
-
166
-
167
-
168
-
169
-
170
-
171
-
172
 |
 |

Table of Contents
PART II
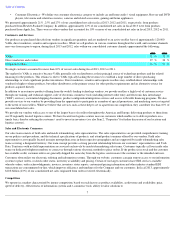
Our common stock is traded on the NASDAQ Stock Market, Inc. (“NASDAQ”) under the symbol “TECD.” We have not paid cash dividends since
fiscal 1983 and the Board of Directors has no current plans to institute a cash dividend payment policy in the foreseeable future. The table below
presents the quarterly high and low sale prices for our common stock as reported by the NASDAQ. As of January 6, 2014, there were 249 holders
of record and we believe that there were 15,419 beneficial holders.
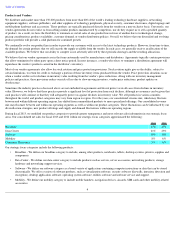
Stock Performance Chart
The five-year stock performance chart below assumes an initial investment of $100 on February 1, 2008 and compares the cumulative total return
for Tech Data, the NASDAQ Stock Market (U.S.) Index, and the Standard Industrial Classification, or SIC, Code 5045 – Computer and Peripheral
Equipment and Software. The comparisons in the table are provided in accordance with SEC requirements and are not intended to forecast or be
indicative of possible future performance of our common stock.
15
ITEM 5.
Market for Registrant
’
s Common Equity, Related Stockholder Matters and Issuer Purchases of Equity Securities.
Sales Price
High
Low
Fiscal year 2013
Fourth quarter $51.19
$42.90
Third quarter $52.46
$42.25
Second quarter $54.72
$45.46
First quarter $59.29
$51.98
Sales Price
High
Low
Fiscal year 2012
Fourth quarter $53.30
$44.16
Third quarter $52.05
$38.21
Second quarter $53.91
$44.38
First quarter $54.25
$46.62