THQ 2005 Annual Report Download - page 3
Download and view the complete annual report
Please find page 3 of the 2005 THQ annual report below. You can navigate through the pages in the report by either clicking on the pages listed below, or by using the keyword search tool below to find specific information within the annual report.-
 1
1 -
 2
2 -
 3
3 -
 4
4 -
 5
5 -
 6
6 -
 7
7 -
 8
8 -
 9
9 -
 10
10 -
 11
11 -
 12
12 -
 13
13 -
 14
14 -
15
-
16
-
17
-
18
-
19
-
20
-
21
-
22
-
23
-
24
-
25
-
26
-
27
-
28
-
29
-
30
-
31
-
32
-
33
-
34
-
35
-
36
-
37
-
38
-
39
-
40
-
41
-
42
-
43
-
44
-
45
-
46
-
47
-
48
-
49
-
50
-
51
-
52
-
53
-
54
-
55
-
56
-
57
-
58
-
59
-
60
-
61
-
62
-
63
-
64
-
65
-
66
-
67
-
68
-
69
-
70
-
71
-
72
-
73
-
74
-
75
-
76
-
77
-
78
-
79
-
80
-
81
-
82
-
83
-
84
-
85
-
86
-
87
-
88
-
89
-
90
-
91
-
92
-
93
-
94
-
95
-
96
-
97
-
98
-
99
-
100
-
101
-
102
-
103
-
104
-
105
-
106
-
107
-
108
-
109
-
110
-
111
-
112
-
113
-
114
-
115
 |
 |

thq inc. 2005 annual report 1
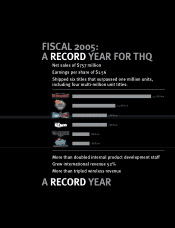
FINANCIAL HIGHLIGHTS
(in thousands, except per share data)
OPERATING RESULTS 2005 2004 2003*
Net Sales $756,731 $640,846 $467,647
Net Income $62,790 (a) $35,839 (b) $2,543 (c)
Operating Margin 9.8% 7.6% 2.6%
Earnings Per Share 0$1.56 0$0.92 0$0.06
FINANCIAL METRICS 2005 2004 2003*
Days Sales Outstanding 39 43 48
Working Capital $401,687 $309,633 $286,899
Stockholders' Equity $548,758 $438,592 $396,413
Return on Invested Capital 28% 22% 11%
See Notes to Consolidated Financial Statements.
(a) Includes a $7.8 million benefit for research and development income tax credits claimed for prior years.
(b) Includes a $4.0 million benefit for a settlement of dispute with directors' and officers' insurance carrier, net of tax.
(c) Includes a charge of $1.8 million due to the other-than-temporary impairment of our investment in Yuke's Co.
*Twelve-month period ended March 31, 2003 (Unaudited)
03*04 05
Revenue
($ Million)
Fiscal Year Fiscal Year Fiscal Year 03*04 05
EPS ($)
03*04 05
Operating
Margin (%)
468
641
757
2.6
7.6
9.8
0.06
0.92
1.56