TD Bank 2005 Annual Report Download - page 18
Download and view the complete annual report
Please find page 18 of the 2005 TD Bank annual report below. You can navigate through the pages in the report by either clicking on the pages listed below, or by using the keyword search tool below to find specific information within the annual report.-
 1
1 -
2
-
3
-
4
-
5
-
6
-
7
-
 8
8 -
 9
9 -
 10
10 -
 11
11 -
 12
12 -
 13
13 -
 14
14 -
 15
15 -
 16
16 -
 17
17 -
 18
18 -
 19
19 -
 20
20 -
 21
21 -
 22
22 -
 23
23 -
 24
24 -
 25
25 -
 26
26 -
 27
27 -
 28
28 -
29
-
30
-
31
-
32
-
33
-
34
-
35
-
36
-
37
-
38
-
39
-
40
-
41
-
42
-
43
-
44
-
45
-
46
-
47
-
48
-
49
-
50
-
51
-
52
-
53
-
54
-
55
-
56
-
57
-
58
-
59
-
60
-
61
-
62
-
63
-
64
-
65
-
66
-
67
-
68
-
69
-
70
-
71
-
72
-
73
-
74
-
75
-
76
-
77
-
78
-
79
-
80
-
81
-
82
-
83
-
84
-
85
-
86
-
87
-
88
-
89
-
90
-
91
-
92
-
93
-
94
-
95
-
96
-
97
-
98
-
99
-
100
-
101
-
102
-
103
-
104
-
105
-
106
-
107
-
108
-
109
-
110
-
111
-
112
-
113
-
114
-
115
-
116
-
117
-
118
-
119
-
120
-
121
-
122
-
123
-
124
-
125
-
126
 |
 |

TD BANK FINANCIAL GROUP ANNUAL REPORT 2005 Management’s Discussion and Analysis
14
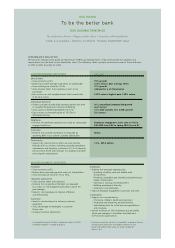
CORPORATE OVERVIEW
TD Bank Financial Group is one of the largest financial services
providers in North America, offering comprehensive retail and
commercial banking, wealth management and wholesale bank-
ing products and services. The Bank’s operations and activities
are organized around operating groups: Canadian Personal and
Commercial Banking, U.S. Personal and Commercial Banking,
Wholesale Banking and Wealth Management. The U.S. Personal
and Commercial Banking segment is a new segment created
from the acquisition of a majority stake in TD Banknorth in 2005.
HOW THE BANK REPORTS
The Bank prepares its financial statements in accordance with
Canadian generally accepted accounting principles (GAAP)
and refers to results prepared in accordance with GAAP as the
”reported basis” or “reported”.
The Bank also utilizes earnings before amortization of intangi-
bles to assess each of its businesses and to measure overall Bank
performance. In addition, in the “Analysis of Performance
against Shareholder Indicators”, the Bank has also excluded
items of note in order to better reflect how management meas-
ures the performance of the Bank. The items of note are listed
in the table below. To arrive at earnings before amortization of
intangibles, the Bank removes amortization of intangibles from
reported basis earnings. To arrive at earnings before amortization
of intangibles and items of note, the Bank removes items of note
from earnings before amortization of intangibles. The Bank’s
intangible amortization of assets primarily relates to the TD
Banknorth acquisition in March 2005 and the Canada Trust
acquisition in fiscal 2000. The items of note relate to items which
management does not believe are indicative of underlying busi-
ness performance. Consequently, the Bank believes that earnings
before amortization of intangibles and, as applicable, items of
note provides the reader with an understanding of how manage-
ment views the Bank’s performance. As explained, earnings
beforeamortization of intangibles and, as applicable, items of
note are different from reported results determined in accor-
dance with GAAP. Earnings before amortization of intangibles
and items of note and related terms used in this report are not
defined terms under GAAP, and therefore may not be compara-
ble to similar terms used by other issuers. Table 1 below provides
a reconciliation between the Bank’s earnings before amortization
of intangibles and items of note and its reported results.
HOW WE PERFORMED
TD Bank Financial Group delivered strong underlying financial
results in 2005. Each of our businesses contributed to shareholder value.
Net income before amortization of intangibles and items of note to reported results1
(millions of Canadian dollars) 2005 2004 2003
Net interest income $ 6,021 $5,773 $5,437
Provision for credit losses 319 336 423
Other income 6,015 4,961 4,469
Non-interest expenses 7,825 7,081 6,881
Income before provision for income taxes and non-controlling interest 3,892 3,317 2,602
Provision for income taxes 899 832 657
Non-controlling interest 132 – –
Income beforeamortization of intangibles and items of note 2,861 2,485 1,945
Items of note impacting income, net of income taxes3
Tax charge related to reorganizations (163) ––
Other tax items 98 ––
Loss on structured derivative portfolios (100) ––
Restructuring charge (29) – (617)
Non-core portfolio loan loss recoveries (sectoral related) 127 426 52
General allowance release 23 43 100
Litigation charge (238) (195) –
Preferred share redemption (13) ––
Hedging impact due to AcG-13 17 (50) –
Net income before amortization of intangibles 2,583 2,709 1,480
Amortization of intangibles, net of income taxes (354) (477) (491)
Net income available to common shareholders – reported basis $ 2,229 $2,232 $ 989
Earnings per share (EPS) before amortization of intangibles and items of note to reported results
(Canadian dollars)
Basic – reported basis $ 3.22 $ 3.41 $ 1.52
Diluted – reported basis 3.20 3.39 1.51
Items of note impacting income (as above) .40 (.34) .72
Amortization of intangibles .51 .72 .75
Item of note impacting EPS .032––
Diluted – before amortization of intangibles and items of note $ 4.14 $ 3.77 $ 2.98
RECONCILIATION OF NON-GAAP MEASURES
TABLE 1
1Certain comparative amounts have been restated.
2Adjusting for the impact of TD Banknorth earnings in the 2005, due to
the one month lag between fiscal quarter ends. Only one month of TD
Banknorth earnings were included in the second quarter while two months
of funding costs and share issuance impacted the quarter.
3Items of note include the following: $163 million tax expense primarily
related to the TD Waterhouse reorganization in 2005 compared with nil in
2004 and nil in 2003; $98 million of other tax benefits in 2005 which
includes the impact of a recent court decision and a tax benefit being
applied to the futuretax asset related to specific provisions compared with
nil in 2004 and nil in 2003; $100 million loss in 2005 related to a reduc-
tion in the estimated value and the exit of certain structured product
businesses compared with nil in 2004 and nil in 2003; $29 million in 2005
restructuring charges of the global structured products businesses com-
pared with nil in 2004 and $617 million in 2003 primarily due to goodwill
write downs; $127 million in 2005 for non-core portfolio loan loss recover-
ies (sectoral related) compared with $426 million in 2004
and $52 million in 2003; $23 million in 2005 general allowance release
compared with $43 million in 2004 and $100 million in 2003; $238 million
in 2005 contingent litigation reserve relating to Enron compared with
$195 million in 2004 and nil in 2003; $13 million in 2005 preferred share
redemption premium compared with nil in 2004 and nil in 2003 and
$17 million in 2005 hedging impact due to AcG-13 compared with ($50)
million in 2004 and nil in 2003.