Sunbeam 2002 Annual Report Download - page 16
Download and view the complete annual report
Please find page 16 of the 2002 Sunbeam annual report below. You can navigate through the pages in the report by either clicking on the pages listed below, or by using the keyword search tool below to find specific information within the annual report.Jarden Corporation
Management’s Discussion and Analysis (Continued)
Results of Operations – Comparing 2001 to 2000
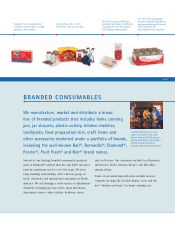
We reported consolidated net sales of $305.0 million in 2001, a decrease of 14.7% from net sales of $357.4
million in 2000. Net sales of the branded consumables segment were $120.6 million in 2001 compared to
$120.4 million in 2000. Increased sales in the United States were offset by decreased sales in Canada due to
unfavorable weather conditions and customers carrying higher levels of inventory over from 2000. Net sales
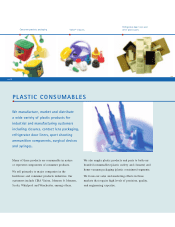
within the plastic consumables segment were $139.9 million in 2001 compared to $179.3 million in 2000. The
decrease of $39.4 million or 22.0% was due primarily to (i) lower demand for industrial thermoformed parts
(part of the divested TPD Assets) in the heavy truck and material handling markets, and (ii) the fact that 2001
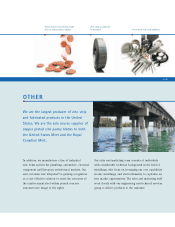
did not include December sales for the divested TPD Assets. Net sales of the other segment decreased to $45.5
million in 2001 from $58.8 million in 2000. This decrease of $13.3 million or 22.6% resulted from lower
demand in all of our zinc product lines.
Our operating loss for 2001 was $113.9 million, including special charges (credits) and reorganization
expenses of $5.0 million and a total loss on divestitures of assets and product lines of $122.9 million. These
results compare to operating income for 2000 of $19.0 million. The factors that contributed to these results are
discussed in the following two paragraphs.
Gross margin percentages increased to 23.7% in 2001 from 23.3% in 2000. Gross margin percentages
increased for branded consumables due primarily to cost efficiencies which continued during 2001 as the
benefits of the segment’s SAP system implementation continued to be realized. The plastic consumables
segment gross margin percentages declined from 16% in 2000 to 13% in 2001. This decrease in gross margin
percentage was due primarily to (i) lower sales of plastic thermoformed parts (part of the divested TPD Assets)
resulting in diminished operating efficiencies, and (ii) lower sales volumes causing fixed overhead costs to be
allocated to less sales of injection molded plastic parts. There was an increase in the other segment’s gross
margin percentages from 28% in 2000 to 29% in 2001.
Selling, general and administrative expenses decreased 7.1% to $53.3 million in 2001 from $57.3 million
in 2000, or, as a percentage of sales increased to 17.5% in 2001 from 16.0% in 2000. Branded consumables
expenses decreased primarily due to lower expenses associated with sales and marketing, warehousing and
shipping. Expenses within the plastic consumables segment decreased primarily as a result of the cost savings
realized due to a third quarter 2000 realignment and consolidation of our divested TPD Assets and the fact that
2001 did not include December expenses for the divested TPD Assets. Excluding the TPD Assets, selling, general
and administrative expenses in the remainder of the plastic consumables segment and the other segment
remained relatively constant.
Goodwill amortization decreased from $6.4 million in 2000 to $5.2 million in 2001 due primarily to our
November 2001 sale of the TPD Assets included in the plastic consumables segment.
We incurred net special charges (credits) and reorganization expenses of $5.0 million in 2001, consisting
of $0.8 million in costs to exit facilities, $2.4 million in stock option compensation, $2.3 million in corporate
restructuring costs, $2.6 million in separation costs for former executive officers and $1.4 million of costs to
evaluate strategic options, partially offset by $4.1 million in pre-tax income related to the discharge of certain
deferred compensation obligations and $0.4 million of income for items related to the divested TPD Assets.
Net interest expense in 2001 was $11.8 million compared to $11.9 million for 2000. The effects of lower
average borrowings outstanding and lower interest rates during 2001 were offset by the write-off of $1.5
million of previously deferred debt issuance costs in November 2001 in conjunction with the amendment to our
credit facility effected in connection with the sale of TPD Assets. Our effective interest rate for the year ended
December 31, 2001 was 7.7%. As a result of decreasing interest rates during 2001, our interest rate swaps, which
were at a fixed interest rate of 5.7%, resulted in additional interest expense to us during the year ended
December 31, 2001.
Our effective tax rate was 32.2% for 2001 compared to 34.0% for 2000. The effective rate for 2001 is lower
than the statutory federal rate primarily because it includes a valuation allowance for tax benefits associated
with the loss on the sale of the TPD Assets. The effective rate for 2000 reflects the recognition of a tax benefit
from exiting the Central European home canning test market.
PG. 14


