SunTrust 2011 Annual Report Download - page 52
Download and view the complete annual report
Please find page 52 of the 2011 SunTrust annual report below. You can navigate through the pages in the report by either clicking on the pages listed below, or by using the keyword search tool below to find specific information within the annual report.-
 1
1 -
2
-
3
-
4
-
5
-
6
-
7
-
8
-
9
-
10
-
11
-
12
-
13
-
14
-
15
-
16
-
17
-
18
-
19
-
20
-
21
-
22
-
23
-
24
-
25
-
26
-
27
-
28
-
29
-
30
-
31
-
32
-
33
-
34
-
35
-
36
-
37
-
38
-
39
-
40
-
41
-
 42
42 -
 43
43 -
 44
44 -
 45
45 -
 46
46 -
 47
47 -
 48
48 -
 49
49 -
 50
50 -
 51
51 -
 52
52 -
 53
53 -
 54
54 -
 55
55 -
 56
56 -
 57
57 -
 58
58 -
 59
59 -
 60
60 -
 61
61 -
 62
62 -
63
-
64
-
65
-
66
-
67
-
68
-
69
-
70
-
71
-
72
-
73
-
74
-
75
-
76
-
77
-
78
-
79
-
80
-
81
-
82
-
83
-
84
-
85
-
86
-
87
-
88
-
89
-
90
-
91
-
92
-
93
-
94
-
95
-
96
-
97
-
98
-
99
-
100
-
101
-
102
-
103
-
104
-
105
-
106
-
107
-
108
-
109
-
110
-
111
-
112
-
113
-
114
-
115
-
116
-
117
-
118
-
119
-
120
-
121
-
122
-
123
-
124
-
125
-
126
-
127
-
128
-
129
-
130
-
131
-
132
-
133
-
134
-
135
-
136
-
137
-
138
-
139
-
140
-
141
-
142
-
143
-
144
-
145
-
146
-
147
-
148
-
149
-
150
-
151
-
152
-
153
-
154
-
155
-
156
-
157
-
158
-
159
-
160
-
161
-
162
-
163
-
164
-
165
-
166
-
167
-
168
-
169
-
170
-
171
-
172
-
173
-
174
-
175
-
176
-
177
-
178
-
179
-
180
-
181
-
182
-
183
-
184
-
185
-
186
-
187
-
188
-
189
-
190
-
191
-
192
-
193
-
194
-
195
-
196
-
197
-
198
-
199
-
200
-
201
-
202
-
203
-
204
-
205
-
206
-
207
-
208
-
209
-
210
-
211
-
212
-
213
-
214
-
215
-
216
-
217
-
218
-
219
-
220
-
221
-
222
-
223
-
224
-
225
-
226
-
227
 |
 |

36
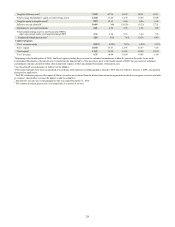
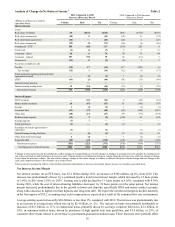
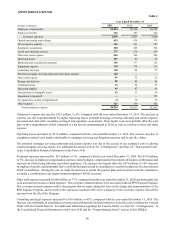
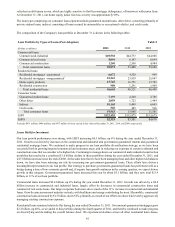
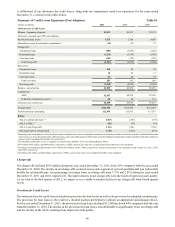
Analysis of Changes in Net Interest Income 1
(Dollars in millions on a taxable-
equivalent basis)
Interest Income
Loans:
Real estate 1-4 family
Real estate construction
Real estate home equity lines
Real estate commercial
Commercial - FTE2
Credit card
Consumer - direct
Consumer - indirect
Nonaccrual
Securities available for sale:
Taxable
Tax-exempt 2
Funds sold and securities purchased under
agreements to resell
LHFS
Interest-bearing deposits
Interest earning trading assets
Total interest income
Interest Expense
NOW accounts
Money market accounts
Savings
Consumer time
Other time
Brokered time deposits
Foreign deposits
Funds purchased
Securities sold under agreements to
repurchase
Interest-bearing trading liabilities
Other short-term borrowings
Long-term debt
Total interest expense
Net change in net interest income
2011 Compared to 2010
Increase (Decrease) Due to
Volume
$9
(50)
(21)
(69)
185
(4)
64
107
(11)
(32)
(15)
—
(43)
—
14
134
—
20
1
(31)
(40)
(11)
(1)
(1)
(1)
—
2
(89)
(151)
$285
Rate
($143)
8
—
(4)
(68)
(3)
6
(92)
6
17
1
(1)
(1)
—
(24)
(298)
(23)
(87)
(3)
(37)
(27)
2
1
—
—
(5)
(2)
(41)
(222)
($76)
Net
($134)
(42)
(21)
(73)
117
(7)
70
15
(5)
(15)
(14)
(1)
(44)
—
(10)
(164)
(23)
(67)
(2)
(68)
(67)
(9)
—
(1)
(1)
(5)
—
(130)
(373)
$209
2010 Compared to 2009 Increase
(Decrease) Due to
Volume
($31)
(93)
(25)
(40)
(193)
6
30
56
(2)
217
(12)
1
(81)
—
(19)
(186)
4
61
1
(63)
(97)
(108)
—
(1)
—
13
1
(147)
(336)
$150
Rate
($138)
21
4
(6)
201
9
14
(51)
5
(222)
(1)
(2)
(15)
—
(7)
(188)
(45)
(148)
(2)
(149)
(97)
64
—
—
(1)
(3)
(3)
(35)
(419)
$231
Table 2
Net
($169)
(72)
(21)
(46)
8
15
44
5
3
(5)
(13)
(1)
(96)
—
(26)
(374)
(41)
(87)
(1)
(212)
(194)
(44)
—
(1)
(1)
10
(2)
(182)
(755)
$381
1Changes in net interest income are attributed to either changes in average balances (volume change) or changes in average rates (rate change) for earning assets
and sources of funds on which interest is received or paid. Volume change is calculated as change in volume times the previous rate, while rate change is change
in rate times the previous volume. The rate/volume change, change in rate times change in volume, is allocated between volume change and rate change at the
ratio each component bears to the absolute value of their total.
2Interest income includes the effects of the taxable-equivalent adjustments to increase tax-exempt interest income to a taxable-equivalent basis.
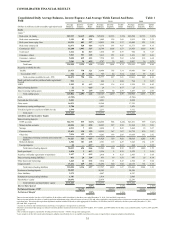
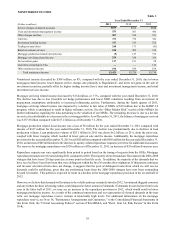
Net Interest Income/Margin
Net interest income, on an FTE basis, was $5.2 billion during 2011, an increase of $209 million, up 4%, from 2010. This
increase was predominantly driven by a continued positive trend in net interest margin, which increased by 12 basis points
to 3.50% in 2011 from 3.38% in 2010. Earning asset yields declined by 13 basis points to 4.26%, compared with 4.39%
during 2010, while the cost of interest-bearing liabilities decreased by 30 basis points over the same period. Net interest
margin increased, predominantly due to the growth in lower-cost deposits, specifically DDA and money market accounts,
along with a decrease in higher-cost time deposits and long-term debt. We expect the net interest margin to decline modestly
in the first quarter of 2012, as earning asset yield compression is expected as a result of the continued low rate environment.
Average earning assets increased by $0.6 billion, or less than 1%, compared with 2010. The increase was predominantly due
to an increase in average loans, which was up by $2.4 billion, or 2%. The increase in loans was primarily attributable to
increases of $3.5 billion, or 11%, in commercial loans, primarily driven by our large corporate borrowers, $2.2 billion, or
29%, in consumer-indirect loans, driven by purchases of high quality auto loan portfolios, and $1.4 billion, or 25%, of
consumer-direct loans related to an increase in government-guaranteed student loans. These increases were partially offset