SunTrust 2011 Annual Report Download - page 132
Download and view the complete annual report
Please find page 132 of the 2011 SunTrust annual report below. You can navigate through the pages in the report by either clicking on the pages listed below, or by using the keyword search tool below to find specific information within the annual report.-
 1
1 -
2
-
3
-
4
-
5
-
6
-
7
-
8
-
9
-
10
-
11
-
12
-
13
-
14
-
15
-
16
-
17
-
18
-
19
-
20
-
21
-
22
-
23
-
24
-
25
-
26
-
27
-
28
-
29
-
30
-
31
-
32
-
33
-
34
-
35
-
36
-
37
-
38
-
39
-
40
-
41
-
42
-
43
-
44
-
45
-
46
-
47
-
48
-
49
-
50
-
51
-
52
-
53
-
54
-
55
-
56
-
57
-
58
-
59
-
60
-
61
-
62
-
63
-
64
-
65
-
66
-
67
-
68
-
69
-
70
-
71
-
72
-
73
-
74
-
75
-
76
-
77
-
78
-
79
-
80
-
81
-
82
-
83
-
84
-
85
-
86
-
87
-
88
-
89
-
90
-
91
-
92
-
93
-
94
-
95
-
96
-
97
-
98
-
99
-
100
-
101
-
102
-
103
-
104
-
105
-
106
-
107
-
108
-
109
-
110
-
111
-
112
-
113
-
114
-
115
-
116
-
117
-
118
-
119
-
120
-
121
-
 122
122 -
 123
123 -
 124
124 -
 125
125 -
 126
126 -
 127
127 -
 128
128 -
 129
129 -
 130
130 -
 131
131 -
 132
132 -
 133
133 -
 134
134 -
 135
135 -
 136
136 -
 137
137 -
 138
138 -
 139
139 -
 140
140 -
 141
141 -
 142
142 -
143
-
144
-
145
-
146
-
147
-
148
-
149
-
150
-
151
-
152
-
153
-
154
-
155
-
156
-
157
-
158
-
159
-
160
-
161
-
162
-
163
-
164
-
165
-
166
-
167
-
168
-
169
-
170
-
171
-
172
-
173
-
174
-
175
-
176
-
177
-
178
-
179
-
180
-
181
-
182
-
183
-
184
-
185
-
186
-
187
-
188
-
189
-
190
-
191
-
192
-
193
-
194
-
195
-
196
-
197
-
198
-
199
-
200
-
201
-
202
-
203
-
204
-
205
-
206
-
207
-
208
-
209
-
210
-
211
-
212
-
213
-
214
-
215
-
216
-
217
-
218
-
219
-
220
-
221
-
222
-
223
-
224
-
225
-
226
-
227
 |
 |

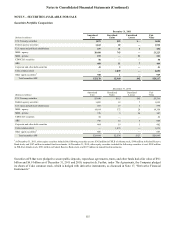
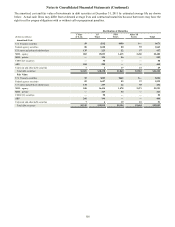
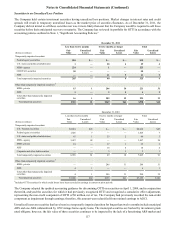
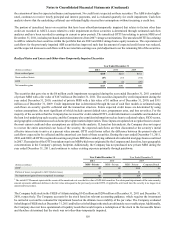
Notes to Consolidated Financial Statements (Continued)
116
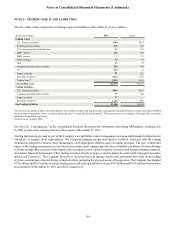
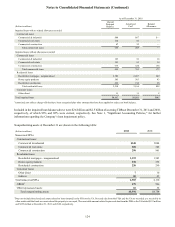
The amortized cost and fair value of investments in debt securities at December 31, 2011 by estimated average life are shown
below. Actual cash flows may differ from estimated average lives and contractual maturities because borrowers may have the
right to call or prepay obligations with or without call or prepayment penalties.
(Dollars in millions)
Amortized Cost:
U.S. Treasury securities
Federal agency securities
U.S. states and political subdivisions
MBS - agency
MBS - private
CDO/CLO securities
ABS
Corporate and other debt securities
Total debt securities
Fair Value:
U.S. Treasury securities
Federal agency securities
U.S. states and political subdivisions
MBS - agency
MBS - private
CDO/CLO securities
ABS
Corporate and other debt securities
Total debt securities
Distribution of Maturities
1 Year
or Less
$9
88
135
802
—
—
260
7
$1,301
$9
89
138
840
—
—
266
7
$1,349
1-5
Years
$212
1,620
223
15,833
196
50
200
4
$18,338
$223
1,697
239
16,434
167
50
198
4
$19,012
5-10
Years
$450
80
22
1,415
56
—
—
17
$2,040
$462
89
22
1,478
54
—
—
19
$2,124
After 10
Years
$—
55
57
2,430
—
—
—
21
$2,563
$—
57
55
2,471
—
—
—
21
$2,604
Total
$671
1,843
437
20,480
252
50
460
49
$24,242
$694
1,932
454
21,223
221
50
464
51
$25,089