SunTrust 2011 Annual Report Download - page 144
Download and view the complete annual report
Please find page 144 of the 2011 SunTrust annual report below. You can navigate through the pages in the report by either clicking on the pages listed below, or by using the keyword search tool below to find specific information within the annual report.-
 1
1 -
2
-
3
-
4
-
5
-
6
-
7
-
8
-
9
-
10
-
11
-
12
-
13
-
14
-
15
-
16
-
17
-
18
-
19
-
20
-
21
-
22
-
23
-
24
-
25
-
26
-
27
-
28
-
29
-
30
-
31
-
32
-
33
-
34
-
35
-
36
-
37
-
38
-
39
-
40
-
41
-
42
-
43
-
44
-
45
-
46
-
47
-
48
-
49
-
50
-
51
-
52
-
53
-
54
-
55
-
56
-
57
-
58
-
59
-
60
-
61
-
62
-
63
-
64
-
65
-
66
-
67
-
68
-
69
-
70
-
71
-
72
-
73
-
74
-
75
-
76
-
77
-
78
-
79
-
80
-
81
-
82
-
83
-
84
-
85
-
86
-
87
-
88
-
89
-
90
-
91
-
92
-
93
-
94
-
95
-
96
-
97
-
98
-
99
-
100
-
101
-
102
-
103
-
104
-
105
-
106
-
107
-
108
-
109
-
110
-
111
-
112
-
113
-
114
-
115
-
116
-
117
-
118
-
119
-
120
-
121
-
122
-
123
-
124
-
125
-
126
-
127
-
128
-
129
-
130
-
131
-
132
-
133
-
 134
134 -
 135
135 -
 136
136 -
 137
137 -
 138
138 -
 139
139 -
 140
140 -
 141
141 -
 142
142 -
 143
143 -
 144
144 -
 145
145 -
 146
146 -
 147
147 -
 148
148 -
 149
149 -
 150
150 -
 151
151 -
 152
152 -
 153
153 -
 154
154 -
155
-
156
-
157
-
158
-
159
-
160
-
161
-
162
-
163
-
164
-
165
-
166
-
167
-
168
-
169
-
170
-
171
-
172
-
173
-
174
-
175
-
176
-
177
-
178
-
179
-
180
-
181
-
182
-
183
-
184
-
185
-
186
-
187
-
188
-
189
-
190
-
191
-
192
-
193
-
194
-
195
-
196
-
197
-
198
-
199
-
200
-
201
-
202
-
203
-
204
-
205
-
206
-
207
-
208
-
209
-
210
-
211
-
212
-
213
-
214
-
215
-
216
-
217
-
218
-
219
-
220
-
221
-
222
-
223
-
224
-
225
-
226
-
227
 |
 |

Notes to Consolidated Financial Statements (Continued)
128
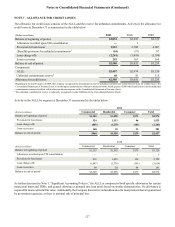
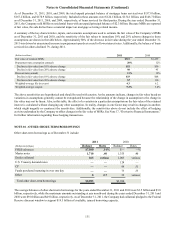
The Company’s LHFI portfolio and related ALLL at December 31 is shown in the tables below:
(Dollars in millions)
Individually evaluated
Collectively evaluated
Total evaluated
LHFI at fair value
Total LHFI
(Dollars in millions)
Individually evaluated
Collectively evaluated
Total evaluated
LHFI at fair value
Total LHFI
2011
Commercial
Carrying
Value
$412
55,458
55,870
2
$55,872
2010
Commercial
Carrying
Value
$906
52,578
53,484
4
$53,488
Associated
ALLL
$34
930
964
—
$964
Associated
ALLL
$175
1,128
1,303
—
$1,303
Residential
Carrying
Value
$3,141
43,088
46,229
431
$46,660
Residential
Carrying
Value
$3,166
42,867
46,033
488
$46,521
Associated
ALLL
$405
949
1,354
—
$1,354
Associated
ALLL
$428
1,070
1,498
—
$1,498
Consumer
Carrying
Value
$39
19,924
19,963
—
$19,963
Consumer
Carrying
Value
$11
15,955
15,966
—
$15,966
Associated
ALLL
$9
130
139
—
$139
Associated
ALLL
$2
171
173
—
$173
Total
Carrying
Value
$3,592
118,470
122,062
433
$122,495
Total
Carrying
Value
$4,083
111,400
115,483
492
$115,975
Associated
ALLL
$448
2,009
2,457
—
$2,457
Associated
ALLL
$605
2,369
2,974
—
$2,974
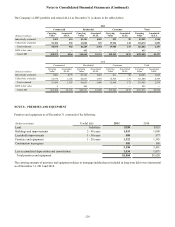
NOTE 8 - PREMISES AND EQUIPMENT
Premises and equipment as of December 31 consisted of the following:
(Dollars in millions)
Land
Buildings and improvements
Leasehold improvements
Furniture and equipment
Construction in progress
Less accumulated depreciation and amortization
Total premises and equipment
Useful Life
Indefinite
2 - 40 years
1 - 30 years
1 - 20 years
2011
$358
1,033
580
1,322
105
3,398
1,834
$1,564
2010
$353
1,008
577
1,385
168
3,491
1,871
$1,620
The carrying amounts of premises and equipment subject to mortgage indebtedness (included in long-term debt) were immaterial
as of December 31, 2011 and 2010.