Stein Mart 2010 Annual Report Download - page 17
Download and view the complete annual report
Please find page 17 of the 2010 Stein Mart annual report below. You can navigate through the pages in the report by either clicking on the pages listed below, or by using the keyword search tool below to find specific information within the annual report.-
 1
1 -
2
-
3
-
4
-
5
-
6
-
 7
7 -
 8
8 -
 9
9 -
 10
10 -
 11
11 -
 12
12 -
 13
13 -
 14
14 -
 15
15 -
 16
16 -
 17
17 -
 18
18 -
 19
19 -
 20
20 -
 21
21 -
 22
22 -
 23
23 -
 24
24 -
 25
25 -
 26
26 -
 27
27 -
28
-
29
-
30
-
31
-
32
-
33
-
34
-
35
-
36
-
37
-
38
-
39
-
40
-
41
-
42
-
43
-
44
-
45
-
46
-
47
-
48
 |
 |
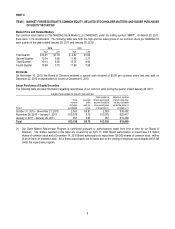
15
Excluding asset impairment and store closing charges, SG&A expenses were $303.0 million or 24.9 percent of sales in 2009
compared to $369.4 million or 27.8 percent of sales in 2008. This $66.4 million decrease in SG&A expenses reflects a $45.8 million
reduction in store operating expenses, a $13.7 million decrease in non-buying expenses in the corporate office, a $5.6 million
decrease in depreciation expense and a $1.3 million decrease in advertising expense. Store operating expenses decreased $35.4
million for the comparable and non-comparable store group due to headcount reductions and other cost saving initiatives and
decreased $10.4 million for the closed store group. Corporate office expenses decreased from 2008 primarily due to compensation
and benefit reductions related to expense reduction initiatives and lower consulting fees. Depreciation expense decreased as a result
of asset impairment charges taken during the fourth quarter of 2008. Advertising expense was slightly lower this year primarily due to
reduced spending on direct mail marketing and newspaper advertising.
Pre-opening expenses for the two stores opened in 2009 and the six stores opened in 2008 amounted to $0.3 million and $1.5 million,
respectively.
Other income, net decreased $2.0 million in 2009 compared to 2008 due to a decrease in the number of credit cards issued through
our co-brand credit card program offset slightly by income from our new magazine subscription program.
Interest expense, net decreased $1.5 million in 2009 compared to 2008 as a result of our having no direct borrowings since the first
quarter of 2009. During the third quarter of 2008, we borrowed an additional $75 million on our revolving credit agreement which
increased our notes payable to banks balance to $100 million. We maintained that notes payable balance through January 31, 2009,
investing excess borrowings in short-term money market funds, and liquidated these money market funds and repaid that portion of
the borrowings during the first quarter of 2009.
The effective tax rate (“ETR”) was 31.5 percent in 2009 compared to a tax benefit of 12.9 percent in 2008. The 2008 rate was
unusually low due to our recording a $19.0 million deferred tax asset valuation allowance through a charge to tax expense during the
fourth quarter of 2008. We recorded the valuation allowance because 2008 operating results produced a cumulative three-year loss,
which is considered a significant factor that is difficult to overcome when determining if a valuation allowance is required. Although we
were profitable in 2009, we remained in a cumulative three-year loss. We perform a quarterly assessment of net deferred tax assets
and plan to carry a valuation allowance until such time that positive evidence is sufficient to justify realization. The 2009 ETR was
lower than the federal statutory rate of 35.0 percent due to the effect of certain book/tax differences on the valuation allowance
including a tax accounting method change made in the third quarter of 2009.
Liquidity and Capital Resources
Our primary source of liquidity is the sale of merchandise inventories. Capital requirements and working capital needs are funded
through a combination of internally generated funds, available cash, credit terms from vendors and a revolving credit facility. Working
capital is needed to support store inventories and capital investments for new store openings and to maintain existing stores.
Historically, our working capital needs are lowest in the first quarter and highest at the end of the third quarter and beginning of the
fourth quarter as we build inventories for the holiday selling season.
As of January 29, 2011, we had $80.2 million in cash and cash equivalents compared to $81.0 million in 2009. We did not use our
revolving credit facility in 2010 and had no direct borrowings at the end of either year. We paid a special dividend of $0.50 per
common share, or $22.2 million, in December 2010.
Net cash provided by operating activities was $49.6 million in 2010, $98.3 million in 2009 and $19.4 million in 2008. Cash provided by
operating activities decreased $48.7 million from 2009. The decrease was primarily due to $12.6 million more cash used for
inventories and accounts payable and $32.7 million less cash from income tax receivable/payable (including $24.6 million of net
operating loss carry back refunds in 2009). Inventories at January 29, 2011 were $14.2 million higher than at January 30, 2010
primarily due to higher inventory balances in our warehouse and distribution centers. The timing of receipts and vendor payments
increased accounts payable at the end of this year compared to last year.
Operating cash flows for 2009 increased $79.0 million over 2008. The increase was primarily due to $66.4 million more cash provided
by net income plus non-cash charges and a $37.7 million increase in cash provided by income taxes receivable/payable (including
$24.6 million of net operating loss carry back refunds received during 2009), offset by $20.3 million more cash used for inventories
and accounts payable and $4.9 million more cash used by other operating activities. While the end of year 2009 inventory balance
was only slightly higher compared to 2008, accounts payable was higher at the end of 2009 due to approximately $30 million of
merchandise in distribution centers at the end of 2009 that was received earlier than at the end of 2008 as part of our new supply
chain network.