Stein Mart 2010 Annual Report Download - page 15
Download and view the complete annual report
Please find page 15 of the 2010 Stein Mart annual report below. You can navigate through the pages in the report by either clicking on the pages listed below, or by using the keyword search tool below to find specific information within the annual report.-
 1
1 -
2
-
3
-
4
-
 5
5 -
 6
6 -
 7
7 -
 8
8 -
 9
9 -
 10
10 -
 11
11 -
 12
12 -
 13
13 -
 14
14 -
 15
15 -
 16
16 -
 17
17 -
 18
18 -
 19
19 -
 20
20 -
 21
21 -
 22
22 -
 23
23 -
 24
24 -
 25
25 -
26
-
27
-
28
-
29
-
30
-
31
-
32
-
33
-
34
-
35
-
36
-
37
-
38
-
39
-
40
-
41
-
42
-
43
-
44
-
45
-
46
-
47
-
48
 |
 |

13
Results of Operations
The following table sets forth each line item of the Consolidated Statements of Operations expressed as a percentage of net sales
(numbers may not add due to rounding):
2010 2009 2008
Net sales 100.0% 100.0% 100.0%
Cost of merchandise sold 73.6 72.9 77.8
Gross profit 26.4 27.1 22.2
Selling, general and administrative expenses 24.4 25.8 29.8
Other income, net 2.5 1.5 1.5
Operating income (loss) 4.5 2.8 (6.0)
Interest income (expense), net -- (0.1)
Income (loss) before income taxes 4.5 2.8 (6.2)
Income tax (provision) benefit (0.4) (0.9) 0.8
Net income (loss) 4.1% 1.9% (5.4)%
Adjusted Results for Items Impacting Comparability
Results for 2010, 2009 and 2008 include items that impact comparability of financial performance. Fiscal 2010 includes a net pretax
gain of $8.5 million recorded during the second quarter, comprised of a $9.7 million pretax gain to recognize cumulative breakage
income on unused gift and merchandise return cards and an offsetting $1.2 million charge associated with our physical inventory
process. The $1.2 million charge related to a change in the process and timing of our physical inventories, as well as accelerating
one-half of our stores’ inventory observations to mid-year from year-end. Asset impairment and store closing charges are reflected in
all years, but were significantly lower in fiscal 2010. Income tax for fiscal 2010 was favorably impacted by the reversal of the
remaining deferred tax valuation allowance established in fiscal 2008.
Reconciliations of operating and net income (loss) on a GAAP basis to adjusted operating and net income (loss) on a non-GAAP
basis are presented in the following table:
2010 2009 2008
Operating
Income
Net
Income
Operating
Income
Net
Income
Operating
Loss
Net
Loss
Income (loss) - (GAAP basis) $53,146 $48,753 $34,647 $23,553 $(80,129) $(71,301)
Adjustments:
Cumulative breakage gain, net of inventory charge (8,481) (6,713) - - - -
Asset impairment and store closing charges 3,093 2,448 11,087 7,589 25,423 16,103
Valuation allowance for deferred tax assets –
(reversal)/initial - (5,973) - - - 18,958
Adjusted income (loss) - (non-GAAP basis) $47,758 $38,515 $45,734 $31,142 $(54,706) $(36,240)
Asset impairment and store closing charges, including costs to relocate stores, are as follows:
2010 2009 2008
Asset impairment charges $1,150 $ 8,429 $20,726
Lease termination costs, net 1,702 2,089 3,568
Severance costs 241 569 1,129
Total $3,093 $11,087 $25,423
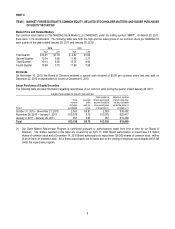
2010 Compared to 2009
Net sales for the year ended January 29, 2011 were $1,181.5 million, a decrease of 3.1 percent from $1,219.1 million for 2009. The
$37.6 million decrease reflects a $20.7 million decrease in the comparable store group and a $26.0 million decrease in the closed
store group, offset by a $9.1 million increase in the non-comparable store group due to the inclusion of sales for a total of four stores
opened in 2010 and 2009. The closed store group includes 5 stores closed in 2010 and 11 stores closed in 2009. Comparable
stores sales for 2010 decreased 1.8 percent compared to 2009.
Gross profit for the year ended January 29, 2011 was $312.3 million or 26.4 percent of net sales compared to $330.4 million or 27.1
percent of net sales for 2009. The $18.1 million decrease in gross profit reflects a $14.2 million decrease in the comparable store
group and a $6.0 million decrease in the closed store group, offset by a $2.1 million increase in the non-comparable store group.