Starwood 2008 Annual Report Download - page 31
Download and view the complete annual report
Please find page 31 of the 2008 Starwood annual report below. You can navigate through the pages in the report by either clicking on the pages listed below, or by using the keyword search tool below to find specific information within the annual report.-
 1
1 -
2
-
3
-
4
-
5
-
6
-
7
-
8
-
9
-
10
-
11
-
12
-
13
-
14
-
15
-
16
-
17
-
18
-
19
-
20
-
 21
21 -
 22
22 -
 23
23 -
 24
24 -
 25
25 -
 26
26 -
 27
27 -
 28
28 -
 29
29 -
 30
30 -
 31
31 -
 32
32 -
 33
33 -
 34
34 -
 35
35 -
 36
36 -
 37
37 -
 38
38 -
 39
39 -
 40
40 -
 41
41 -
42
-
43
-
44
-
45
-
46
-
47
-
48
-
49
-
50
-
51
-
52
-
53
-
54
-
55
-
56
-
57
-
58
-
59
-
60
-
61
-
62
-
63
-
64
-
65
-
66
-
67
-
68
-
69
-
70
-
71
-
72
-
73
-
74
-
75
-
76
-
77
-
78
-
79
-
80
-
81
-
82
-
83
-
84
-
85
-
86
-
87
-
88
-
89
-
90
-
91
-
92
-
93
-
94
-
95
-
96
-
97
-
98
-
99
-
100
-
101
-
102
-
103
-
104
-
105
-
106
-
107
-
108
-
109
-
110
-
111
-
112
-
113
-
114
-
115
-
116
-
117
-
118
-
119
-
120
-
121
-
122
-
123
-
124
-
125
-
126
-
127
-
128
-
129
-
130
-
131
-
132
-
133
-
134
-
135
-
136
-
137
-
138
-
139
-
140
-
141
-
142
-
143
-
144
-
145
-
146
-
147
-
148
-
149
-
150
-
151
-
152
-
153
-
154
-
155
-
156
-
157
-
158
-
159
-
160
-
161
-
162
-
163
-
164
-
165
-
166
-
167
-
168
-
169
-
170
-
171
-
172
-
173
-
174
-
175
-
176
-
177
-
178
 |
 |

subject to achieving the EP Threshold, the Compensation Committee retains the ability to consider whether an
adjustment of the financial goals for any year is necessitated by exceptional circumstances, e.g., an unan-
ticipated and material downturn in the business cycle that triggers, in response, an increased focus by the
Compensation Committee on the Company’s performance relative to the industry. This ability is intended to be
narrowly and infrequently used and would, if applicable, be detailed in the proxy.
Performance against the financial targets determined 60% of Mr. van Paasschen’s total target opportunity
and 50% of the total target opportunities for the other Named Executive Officers. Subject to achieving the EP
Threshold, actual incentives paid to Named Executive Officers for financial performance may range from 0%
to 200% of the pre-determined target bonus for this category of performance. For Named Executive Officers,
the Company performance portion is based 50% on earnings per share and 50% on operating income of the
Company, provided that Mr. Avril’s Company financial portion was pro-rated based on his services for SVO,
the Company’s vacation ownership subsidiary, prior to his promotion in September 2008. From January
through September, the Company financial performance portion is based on 50% on earnings per share and
50% on the net income for SVO.
Once the EP Threshold is achieved, a minimum amount is generally paid on a component of the
“Financial Goals” portion of the annual bonus subject to the Compensation Committee applying its discretion
to reduce awards. Further, once a certain level of performance is achieved, the bonus payout for the applicable
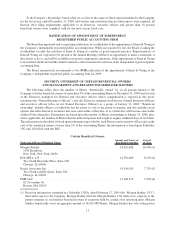
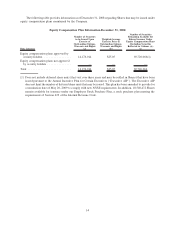
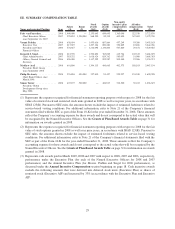
metric is limited to 200% (i.e., the “performance maximum”). The table below sets forth for each metric the
performance levels for 2008 which would have resulted in 100% payout (i.e. “target”), the performance
minimum level that would have resulted in a 50% payout and the performance maximum level that would have
resulted in a 200% payout. In addition, the table sets forth the mid-points of performance and payout between
the performance minimum to target and from target to performance maximum:
Minimum
(50%)
Mid-point
(75%)
Target
(100%)
Mid-point
(150%)
Maximum
(200%)
Earnings per Share ...... $ 1.98 $ 2.23 $ 2.48 $ 2.79 $ 3.10
Company Operating
Income . ............ $720,200,000 $810,300,000 $900,300,000 $1,012,800,000 $1,125,400,000
SVO Net Income ....... $ 92,000,000 $103,500,000 $115,000,000 $ 138,000,000 $ 161,000,000
For the 2008 performance period, EBITDA (which exceeded the EP Threshold) for purposes of
determining bonuses was $1,157,000,000. Actual results for earnings per share, Company operating income
and SVO net income were $2.36, $819,300,000 and $85,000,000, respectively. Using the metrics described
above resulted in a payout at 82% of target for the Company performance portion of bonuses for the 2008
performance period for the Named Executive Officers other than Mr. Avril. For Mr. Avril, the financial
performance component was paid at 68% of target (61% attributable to SVO for eight months and 82%
attributable to corporate for four months).
Strategic/Operational Goals.
The strategic/operational performance goals for Named Executive Officers under the Executive Plan
consists of “Big 5” and leadership competency objectives that link individual contributions to execution of our
business strategy and major financial and operating goals. “Big 5” refers to each executive’s specific
deliverables within the Company’s critical performance categories — operational excellence, brand enhance-
ment, innovation, growth, and customer experience. As part of a structured process that cascades down
throughout the Company, these objectives are developed at the beginning of the year, and they integrate and
align an executive with the Company’s strategic and operational plan. Achievement of “Big 5” objectives
typically accounts for 80% of the strategic/operational performance evaluation, and achievement of leadership
competency objectives typically accounts for 20% of such evaluation. The portion of annual incentive awards
attributable to strategic/operational/talent management performance represents 40% of Mr. van Paasschen’s
total target opportunity and 50% of the total target opportunities for the other Named Executive Officers.
Actual incentives paid to Named Executive Officers for strategic/operational performance may range from 0%
to 175% of the pre-determined target amount for this category of performance. The evaluation process for Mr.
19