Southwest Airlines 2002 Annual Report Download - page 16
Download and view the complete annual report
Please find page 16 of the 2002 Southwest Airlines annual report below. You can navigate through the pages in the report by either clicking on the pages listed below, or by using the keyword search tool below to find specific information within the annual report.
Southwest airlines co. 2002 annual report
14
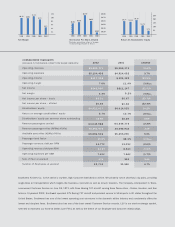
SELECTED CONSOLIDATED FINANCIAL DATA
(In thousands, except per share amounts) 2002(3) 2001(3) 2000 1999
Operating revenues:
Passenger(2) $5,341,349 $ 5, 378, 702 $ 5,467,965 $ 4,562,616
Freight 84,675 91,270 110,742 102,990
Other(2) 95,747 85,202 70,853 69, 981
Total operating revenues 5,521,771 5,555,174 5,649,560 4,735,587
Operating expenses 5,104,433 4,924,052 4,628,415 3,954,011
Operating income 417,338 631,122 1,021,145 781,576
Other expenses (income), net 24,656 (196,537) 3,781 7,965
Income before income taxes 392,682 827,659 1,017,364 773,611
Provision for income taxes 151,713 316,512 392,140 299,233
Net income (1) $240,969 $ 511,147 $ 625,224 $ 474, 378
Net income per share, basic (1) $.31 $.67 $.84 $.63
Net income per share, diluted (1) $.30 $.63 $.79 $.59
Cash dividends per common share $.0180 $.0180 $.0148 $.0143
Total assets $ 8,953,750 $ 8,997,141 $ 6,669,572 $ 5,653,703
Long-term debt less current maturities $ 1,552,781 $ 1,327,158 $ 760,992 $ 871, 717
Stockholders’ equity $ 4,421,617 $ 4,014,053 $ 3,451,320 $ 2,835, 788
CONSOLIDATED FINANCIAL RATIOS
Return on average total assets(1) 2.7% 6.5% 10.1 % 9.2%
Return on average stockholders’ equity(1) 5.7% 13.7% 19.9% 18.1%
CONSOLIDATED OPERATING STATISTICS
Revenue passengers carried 63,045,988 64,446,773 63,678,261 57,500,213
RPMs (000s) 45,391,903 44,493,916 42,215, 162 36,479,322
ASMs (000s) 68,886,546 65,295,290 59,909,965 52,855,467
Passenger load factor 65.9% 68.1% 70.5% 69.0%
Average length of passenger haul 720 690 663 634
Trips flown 947,331 940,426 903,754 846,823
Average passenger fare(2) $84.72 $83.46 $85.87 $79.35
Passenger revenue yield per RPM(2) 11.77¢ 12.09¢ 12.95¢ 12.51¢
Operating revenue yield per ASM 8.02¢ 8.51¢ 9.43¢ 8.96¢
Operating expenses per ASM 7.41¢ 7.54¢ 7.73¢ 7.48¢
Operating expenses per ASM, excluding fuel 6.30¢ 6.36¢ 6.38¢ 6.55¢
Fuel cost per gallon (average) 68.01¢ 70.86¢ 78.69¢ 52.71¢
Number of Employees at yearend 33,705 31,580 29, 274 27,653
Size of fleet at yearend (4) 375 355 344 312
(1) Before cumulative effect of change in accounting principle
(2) Includes effect of reclassification of revenue in 1999 through 1995 related to the sale of flight segment
credits from Other to Passenger due to the accounting change implemented in 2000
(3) Certain figures include special items related to the September 11, 2001, terrorist attacks
(4) Includes leased aircraft
(5) Includes certain estimates for Morris
TEN-YEAR SUMMARY


