Southwest Airlines 1994 Annual Report Download - page 3
Download and view the complete annual report
Please find page 3 of the 1994 Southwest Airlines annual report below. You can navigate through the pages in the report by either clicking on the pages listed below, or by using the keyword search tool below to find specific information within the annual report.-
 1
1 -
 2
2 -
 3
3 -
 4
4 -
 5
5 -
 6
6 -
 7
7 -
 8
8 -
 9
9 -
 10
10 -
 11
11 -
 12
12 -
 13
13 -
 14
14 -
15
-
16
-
17
-
18
-
19
-
20
-
21
-
22
-
23
-
24
-
25
-
26
-
27
-
28
-
29
-
30
-
31
-
32
-
33
-
34
-
35
-
36
-
37
-
38
-
39
-
40
-
41
-
42
 |
 |

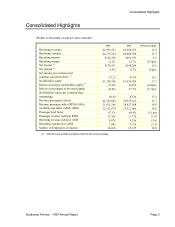
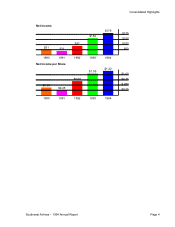
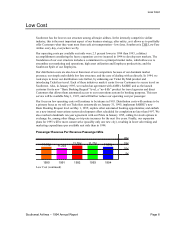
Consolidated Highlights
Southwest Airlines – 1994 Annual Report Page 3
Consolidated Highlights
(Dollars in thousands except per share amounts)
1994 1993 Percent Change
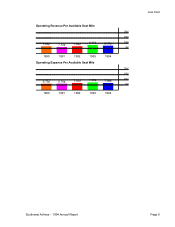
Operating revenues $2,591,933 $2,296,673 12.9
Operating expenses $2,275,224 $2,004,700 13.5
Operating income $316,709 $291,973 8.5
Operating margin 12.2% 12.7% (0.5)pts.
Net income (1) $179,331 $154,284 16.2
Net margin (1) 6.9% 6.7% 0.2pts.
Net income per common and
common equivalent share (1) $1.22 $1.05 16.2
Stockholders equity $1,238,706 $1,054,019 17.5
Return on average stockholders equity (1) 15.6% 16.0% (0.4)pts.
Debt as a percentage of invested capital 32.0% 37.7% (5.7)pts.
Stockholders equity per common share
outstanding $8.65 $7.38 17.2
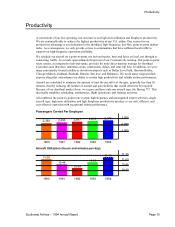
Revenue passengers carried 42,742,602 36,955,221 15.7
Revenue passenger miles (RPM) (000s) 21,611,266 18,827,288 14.8
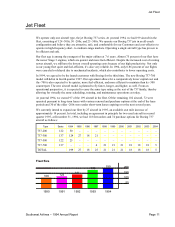
Available seat miles (ASM) (000s) 32,123,974 27,511,000 16.8
Passenger load factor 67.3% 68.4% (1.1)pts
Passenger revenue yield per RPM 11.56¢ 11.77¢ (1.8)
Operating revenue yield per ASM 8.07¢ 8.35¢ (3.4)
Operating expenses per ASM 7.08¢ 7.25¢ (2.3)
Number of Employees at yearend 16,818 15,175 10.8
(1) 1993 amounts exclude cumulative effect of accounting changes