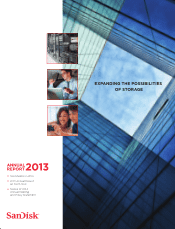
SanDisk 2013 Annual Report Download - page 4
Download and view the complete annual report
Please find page 4 of the 2013 SanDisk annual report below. You can navigate through the pages in the report by either clicking on the pages listed below, or by using the keyword search tool below to find specific information within the annual report.-
 1
1 -
 2
2 -
 3
3 -
 4
4 -
 5
5 -
 6
6 -
 7
7 -
 8
8 -
 9
9 -
 10
10 -
 11
11 -
 12
12 -
 13
13 -
 14
14 -
 15
15 -
16
-
17
-
18
-
19
-
20
-
21
-
22
-
23
-
24
-
25
-
26
-
27
-
28
-
29
-
30
-
31
-
32
-
33
-
34
-
35
-
36
-
37
-
38
-
39
-
40
-
41
-
42
-
43
-
44
-
45
-
46
-
47
-
48
-
49
-
50
-
51
-
52
-
53
-
54
-
55
-
56
-
57
-
58
-
59
-
60
-
61
-
62
-
63
-
64
-
65
-
66
-
67
-
68
-
69
-
70
-
71
-
72
-
73
-
74
-
75
-
76
-
77
-
78
-
79
-
80
-
81
-
82
-
83
-
84
-
85
-
86
-
87
-
88
-
89
-
90
-
91
-
92
-
93
-
94
-
95
-
96
-
97
-
98
-
99
-
100
-
101
-
102
-
103
-
104
-
105
-
106
-
107
-
108
-
109
-
110
-
111
-
112
-
113
-
114
-
115
-
116
-
117
-
118
-
119
-
120
-
121
-
122
-
123
-
124
-
125
-
126
-
127
-
128
-
129
-
130
-
131
-
132
-
133
-
134
-
135
-
136
-
137
-
138
-
139
-
140
-
141
-
142
-
143
-
144
-
145
-
146
-
147
-
148
-
149
-
150
-
151
-
152
-
153
-
154
-
155
-
156
-
157
-
158
-
159
-
160
-
161
-
162
-
163
-
164
-
165
-
166
-
167
-
168
-
169
-
170
-
171
-
172
-
173
-
174
-
175
-
176
-
177
-
178
-
179
-
180
-
181
-
182
-
183
-
184
-
185
-
186
-
187
-
188
-
189
-
190
-
191
-
192
-
193
-
194
-
195
-
196
-
197
-
198
-
199
-
200
-
201
-
202
-
203
-
204
-
205
-
206
-
207
-
208
-
209
-
210
-
211
-
212
-
213
-
214
-
215
-
216
-
217
-
218
-
219
-
220
-
221
-
222
-
223
-
224
-
225
-
226
-
227
-
228
-
229
-
230
-
231
-
232
 |
 |

18APR201414135539
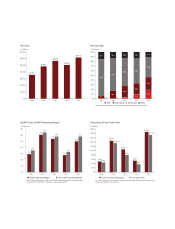
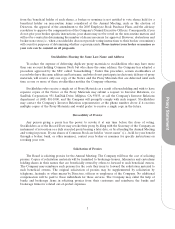
Operating & Free Cash Flow
$488
$1,452
$1,054
$530
$1,864
$450
$1,344
$795
$360
$1,726
$0
$200
$400
$600
$800
$1,000
$1,200
$1,400
$1,600
$1,800
$2,000
2009 2010 2011 2012 2013
Free Cash Flow equals Cash Flow from Operations less Acquisition of Property and Equipment and
Other includes revenue from License & Royalty, Wafers, Components and Accessories
Net Investin
g
Activity in Flash Ventures.
Cash Flow from Operations Free Cash Flow
$ in Millions
2009 2010 2011 2012 2013
Revenue Mix
5% 1%
16%
25%
24%
19%
78%
69%
27%
1% 3% 9%
58% 53%
43%
16% 14% 14% 14% 11%
0%
10%
20%
30%
40%
50%
60%
70%
80%
90%
100%
% of Revenue
SSD Embedded Removable Other
Revenue
$ in Millions
$3,567
$4,827
$5,662
$5,053
$6,170
$0
$1,000
$2,000
$3,000
$4,000
$5,000
$6,000
$7,000
2009 2010 2011 2012 2013
15%
18%
30%
32%
27%
29%
14%
16%
25%
29%
0%
5%
10%
15%
20%
25%
30%
35%
% of Revenue
GAAP & Non-GAAP Operating Margin
GAAP Operating Margin Non-GAAP Operating Margin
Non-GAAP operating margin excludes share-based compensation expense, acquisition-related
amortization and impairments, and purchase accountin
g
adjustments.
2009 2010 2011 2012 2013