SanDisk 2002 Annual Report Download - page 8
Download and view the complete annual report
Please find page 8 of the 2002 SanDisk annual report below. You can navigate through the pages in the report by either clicking on the pages listed below, or by using the keyword search tool below to find specific information within the annual report.-
 1
1 -
 2
2 -
 3
3 -
 4
4 -
 5
5 -
 6
6 -
 7
7 -
 8
8 -
 9
9 -
 10
10 -
 11
11 -
 12
12 -
 13
13 -
 14
14 -
 15
15 -
 16
16 -
 17
17 -
 18
18 -
 19
19 -
20
-
21
-
22
-
23
-
24
-
25
-
26
-
27
-
28
-
29
-
30
-
31
-
32
-
33
-
34
-
35
-
36
-
37
-
38
-
39
-
40
-
41
-
42
-
43
-
44
-
45
-
46
-
47
-
48
-
49
-
50
-
51
-
52
-
53
-
54
-
55
-
56
 |
 |

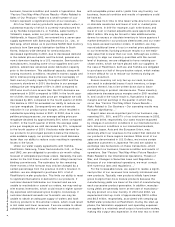
6 Sa nDisk C o rp ora tio n
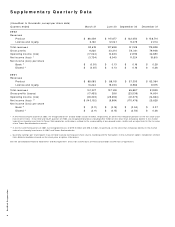
S u p p le m e n t a r y Q u a r t e r ly D a t a
(Unaudited. In thousands, except per share data)
Quarters ended M arch 31 June 30 Septem ber 30 December 31
2002
Revenues
Product $ 86,459 $ 115,677 $ 132,050 $ 158,714
License and royalty 6,160 12,021 9,078 21,114
Total revenues 92,619 127,698 141,128 179,828
Gross profits 11,220 43,314 54,341 79,946
Operating incom e (loss) (17,044) 10,633 21,912 42,650
Net incom e (loss) * (3,734) 9,040 11,324 19,610
Net incom e (loss) per share
Basic +$ (0.05) $ 0.13 $ 0.16 $ 0.28
Diluted +$ (0.05) $ 0.13 $ 0.16 $ 0.26
2001
Revenues
Product $ 88,083 $ 88,115 $ 57,305 $ 83,364
License and royalty 13,244 19,033 8,582 8,575
Total revenues 101,327 107,148 65,887 91,939
Gross profits (losses) (17,453) 396 (23,539) 14,604
Operating incom e (loss) (48,303) (28,650) (61,373) (14,664)
Net incom e (loss) ** $ (143,102) (9,994) (170,476) 25,628
Net incom e (loss) per share
Basic +$ (2.11) $ (0.15) $ (2.50) $ 0.37
Diluted +$ (2.11) $ (0.15) $ (2.50) $ 0.36
* In the third and fourth quarter of 2002, w e recognized losses of $0.9 m illion and $1.8 m illion, respectively, on other-than-tem porary declines in the fair value of our
investm ent in Divio. In the third and fourth quarters of 2002, w e recognized total losses totaling $15.2 m illion on the other-than-tem porary decline in the m arket
value of our foundry investm ent in Tow er Sem iconductor, w rite- dow ns related to the recoverability of our prepaid w afer credits and an adjustm ent in the fair value
of our Tow er Sem iconductor w arrants.
** In the first and third quarters of 2001, w e recognized losses of $179.9 m illion and $116.4 m illion, respectively, on the other-than-tem porary decline in the m arket
value of our foundry investm ents in UM C and Tow er Sem iconductor.
+ Quarterly earnings per share figures m ay not total to yearly earnings per share, due to rounding and the fluctuations in the num ber of options included or omitted
from diluted calculations based on the stock price or option strike prices.
See the Consolidated Financial Statem ents and M anagem ent’s Discussion and Analysis of Financial Condition and Results of Operations.