SanDisk 2002 Annual Report Download - page 7
Download and view the complete annual report
Please find page 7 of the 2002 SanDisk annual report below. You can navigate through the pages in the report by either clicking on the pages listed below, or by using the keyword search tool below to find specific information within the annual report.-
 1
1 -
 2
2 -
 3
3 -
 4
4 -
 5
5 -
 6
6 -
 7
7 -
 8
8 -
 9
9 -
 10
10 -
 11
11 -
 12
12 -
 13
13 -
 14
14 -
 15
15 -
 16
16 -
 17
17 -
 18
18 -
19
-
20
-
21
-
22
-
23
-
24
-
25
-
26
-
27
-
28
-
29
-
30
-
31
-
32
-
33
-
34
-
35
-
36
-
37
-
38
-
39
-
40
-
41
-
42
-
43
-
44
-
45
-
46
-
47
-
48
-
49
-
50
-
51
-
52
-
53
-
54
-
55
-
56
 |
 |

5 2 0 0 2 Annual Re port
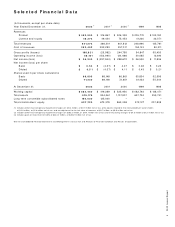
S e le c t e d F in a n c ia l D a t a
(In thousands, except per share data)
Year Ended Decem ber 31, 2 0 0 2 12001 22000 31999 1998
Revenues
Product $ 4 9 2 ,9 0 0 $ 316,867 $ 526,359 $ 205,770 $ 103,190
License and royalty 4 8 ,3 7 3 49,434 75,453 41,220 32,571
Total revenues 5 4 1,2 7 3 366,301 601,812 246,990 135,761
Cost of revenues 3 5 2 ,4 5 2 392,293 357,017 152,143 80,311
Gross profits (losses) 18 8 ,8 2 1 (25,992) 244,795 94,847 55,450
Operating incom e (loss) 5 8 ,15 1 (152,990) 124,666 30,085 12,810
Net incom e (loss) $ 3 6 ,2 4 0 $ (297,944) $ 298,672 $ 26,550 $ 11,836
Net incom e (loss) per share
Basic $ 0 .5 3 $ (4.37) $ 4.47 $ 0.48 $ 0.23
Diluted $ 0 .5 1 $ (4.37) $ 4.11 $ 0.43 $ 0.2 1
Shares used in per share calculations
Basic 6 8 ,8 0 5 68,148 66,861 55,834 52,596
Diluted 7 1,2 3 0 68,148 72,651 61,433 55,344
At Decem ber 31, 2 0 0 2 2001 2000 1999 1998
Working capital $ 5 8 4 ,4 5 0 $ 419,289 $ 525,950 $ 482,793 $ 138,471
Total assets 9 7 6 ,17 9 934,261 1,107,907 657,724 255,741
Long-term convertible subordinated notes 15 0 ,0 0 0 125,000–––
Total stockholders’ equity 6 2 7 ,7 2 0 675,379 863,058 572,127 207,838
(1) Includes other- than-tem porary im pairm ent charges of $14.4 m illion, or $8.7 m illion net of tax, write-downs related to the recoverability of w afer credits
of $2.8 m illion, or $1.8 m illion net of tax, and an adjustm ent to the fair value of w arrants of $0.7 m illion, or $0.5 m illion net of tax.
(2) Includes other- than-tem porary im pairm ent charges of $302.3 m illion, or $188.1 m illion net of tax and restructuring charges of $8.5 m illion or $6.7 million net of tax.
(3) Includes gain on investm ent of UM C of $344.2 m illion, or $203.9 m illion net of tax.
See the Consolidated Financial Statem ents and M anagem ent’s Discussion and Analysis of Financial Condition and Results of Operations.