Sally Beauty Supply 2013 Annual Report Download - page 6
Download and view the complete annual report
Please find page 6 of the 2013 Sally Beauty Supply annual report below. You can navigate through the pages in the report by either clicking on the pages listed below, or by using the keyword search tool below to find specific information within the annual report.-
 1
1 -
 2
2 -
 3
3 -
 4
4 -
 5
5 -
 6
6 -
 7
7 -
 8
8 -
 9
9 -
 10
10 -
 11
11 -
 12
12 -
 13
13 -
 14
14 -
 15
15 -
 16
16 -
 17
17 -
18
-
19
-
20
-
21
-
22
-
23
-
24
-
25
-
26
-
27
-
28
-
29
-
30
-
31
-
32
-
33
-
34
-
35
-
36
-
37
-
38
-
39
-
40
-
41
-
42
-
43
-
44
-
45
-
46
-
47
-
48
-
49
-
50
-
51
-
52
-
53
-
54
-
55
-
56
-
57
-
58
-
59
-
60
-
61
-
62
-
63
-
64
-
65
-
66
-
67
-
68
-
69
-
70
-
71
-
72
-
73
-
74
-
75
-
76
-
77
-
78
-
79
-
80
-
81
-
82
-
83
-
84
-
85
-
86
-
87
-
88
-
89
-
90
-
91
-
92
-
93
-
94
-
95
-
96
-
97
-
98
-
99
-
100
-
101
-
102
-
103
-
104
-
105
-
106
-
107
-
108
-
109
-
110
-
111
-
112
-
113
-
114
-
115
-
116
-
117
-
118
-
119
-
120
-
121
-
122
-
123
-
124
-
125
-
126
-
127
-
128
-
129
-
130
-
131
-
132
-
133
-
134
-
135
-
136
-
137
-
138
-
139
-
140
-
141
-
142
-
143
-
144
-
145
-
146
-
147
-
148
-
149
-
150
-
151
-
152
-
153
-
154
-
155
-
156
 |
 |

FELLOW SHAREHOLDERSFELLOW SHAREHOLDERS
This past year was marked by numerous accomplishments and the This past year was marked by numerous accomplishments and the
implementation of many of our strategic initiatives. Comparison to ourimplementation of many of our strategic initiatives. Comparison to our
record-breaking growth in FY 2012 and soft retail traffic in our Sally U.S. record-breaking growth in FY 2012 and soft retail traffic in our Sally U.S.
business made financial performance a particular challenge. Nevertheless,business made financial performance a particular challenge. Nevertheless,
our performance was solid as our business continued to excel inour performance was solid as our business continued to excel in
Beauty Systems Group (BSG) and Sally International.Beauty Systems Group (BSG) and Sally International.
PAGEPAGE SALLY BEAUTY HOLDINGSSALLY BEAUTY HOLDINGS
22
HIGHLIGHTS OF FY 2013:HIGHLIGHTS OF FY 2013:
••Invested in our growth through the addition of 170 stores;Invested in our growth through the addition of 170 stores;
••Converted our 2,450 Sally U.S. stores to a newConverted our 2,450 Sally U.S. stores to a new
point-of-sale platform;
••Implemented Enterprise Resource Planning (ERP) system in Implemented Enterprise Resource Planning (ERP) system in
Mexico and Belgium; began conversion in Germany and France; Mexico and Belgium; began conversion in Germany and France;
• • Completed the transition to a new distribution center in the U.K.; Completed the transition to a new distribution center in the U.K.;
••Generated consolidated operating cash flow of $310 million; andGenerated consolidated operating cash flow of $310 million; and
• • Repurchased $510 million, or 19 million shares, of common stock. Repurchased $510 million, or 19 million shares, of common stock.
I am pleased to share the highlights of our FY 2013I am pleased to share the highlights of our FY 2013
in more detail. in more detail.
FINANCIAL RESULTS IN FY 2013FINANCIAL RESULTS IN FY 2013
During FY 2013, our consolidated net sales exceededDuring FY 2013, our consolidated net sales exceeded
$3.6 billion, growth of 2.8 percent over the prior year. This $3.6 billion, growth of 2.8 percent over the prior year. This
revenue increase was driven by the addition of new stores revenue increase was driven by the addition of new stores
and growth in global same-store sales of 0.8 percent. Gross and growth in global same-store sales of 0.8 percent. Gross
profit ended the year at $1.8 billion, a 3.0 percent growth. This profit ended the year at $1.8 billion, a 3.0 percent growth. This
resulted in a gross profit margin of 49.6 percent, an expansion resulted in a gross profit margin of 49.6 percent, an expansion
of 10 basis points. Diluted earnings per share reachedof 10 basis points. Diluted earnings per share reached
$1.48, a 19.4 percent year-over-year growth. We generated$1.48, a 19.4 percent year-over-year growth. We generated
$310 million in net operating cash, which funded our $310 million in net operating cash, which funded our
investments in company growth and stock buy-backs.investments in company growth and stock buy-backs.
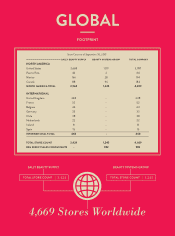
GROWING GLOBALLYGROWING GLOBALLY
In FY 2013, we continued to grow through organic store In FY 2013, we continued to grow through organic store
openings and acquisitions, increasing our store footprint byopenings and acquisitions, increasing our store footprint by
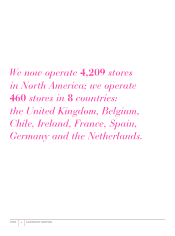
3.8 percent (170 stores), for a total store count of 4,669.3.8 percent (170 stores), for a total store count of 4,669.
We now operate 3,831 stores in the United States andWe now operate 3,831 stores in the United States and
Puerto Rico. Outside of the U.S. and Puerto Rico, we operatePuerto Rico. Outside of the U.S. and Puerto Rico, we operate
838 stores in ten countries: Canada, Mexico, Chile, the 838 stores in ten countries: Canada, Mexico, Chile, the
United Kingdom, Ireland, Belgium, France, Germany, the United Kingdom, Ireland, Belgium, France, Germany, the
Netherlands and Spain. In FY 2014, we believe we can Netherlands and Spain. In FY 2014, we believe we can
achieve consolidated store growth of 3 percent to 4 percent, achieve consolidated store growth of 3 percent to 4 percent,
with almost 40 percent of store expansion coming from with almost 40 percent of store expansion coming from
international locations.international locations.
BUSINESS SEGMENT FINANCIAL RESULTS BUSINESS SEGMENT FINANCIAL RESULTS
SALLY BEAUTY SUPPLYSALLY BEAUTY SUPPLY
Net sales at our Sally Beauty Supply segment reachedNet sales at our Sally Beauty Supply segment reached
$2.2 billion, an increase of 1.4 percent when compared to our $2.2 billion, an increase of 1.4 percent when compared to our
record growth in FY 2012. Sales growth was driven by 115 net record growth in FY 2012. Sales growth was driven by 115 net
new stores and growth in our international business, but was new stores and growth in our international business, but was
partially oset by a same store sales decline of 0.6 percent. partially oset by a same store sales decline of 0.6 percent.
We believe a change in our marketing tactics over the course We believe a change in our marketing tactics over the course
of several months was the primary reason for the same store of several months was the primary reason for the same store
sales underperformance. Although we are disappointed with sales underperformance. Although we are disappointed with
this performance, we have identified several opportunities to this performance, we have identified several opportunities to
improve customer trac in the coming year.improve customer trac in the coming year.
Gross margin reached a record annual high of 54.9 percent, Gross margin reached a record annual high of 54.9 percent,
an expansion of 30 basis points over FY 2012. The consistent an expansion of 30 basis points over FY 2012. The consistent
shift in product and customer mix in our U.S. and international shift in product and customer mix in our U.S. and international
business continues to drive our gross margin performance. business continues to drive our gross margin performance.
Segment operating earnings were $437.0 million, upSegment operating earnings were $437.0 million, up
1.7 percent from $429.5 million in FY 2012. Segment 1.7 percent from $429.5 million in FY 2012. Segment
operating margins reached an annual high of 19.6 percent operating margins reached an annual high of 19.6 percent
of sales, up 10 basis points from 19.5 percent in FY 2012. of sales, up 10 basis points from 19.5 percent in FY 2012.
Sally Beauty Supply ended the fiscal year with 3,424 stores Sally Beauty Supply ended the fiscal year with 3,424 stores
worldwide: 2,710 in the U.S. and Puerto Rico, and the worldwide: 2,710 in the U.S. and Puerto Rico, and the
remaining 714 stores in Canada, Mexico, Chile, theremaining 714 stores in Canada, Mexico, Chile, the
United Kingdom, Ireland, Belgium, France, Germany,United Kingdom, Ireland, Belgium, France, Germany,
the Netherlands and Spain.the Netherlands and Spain.