Sally Beauty Supply 2013 Annual Report Download - page 12
Download and view the complete annual report
Please find page 12 of the 2013 Sally Beauty Supply annual report below. You can navigate through the pages in the report by either clicking on the pages listed below, or by using the keyword search tool below to find specific information within the annual report.-
 1
1 -
 2
2 -
 3
3 -
 4
4 -
 5
5 -
 6
6 -
 7
7 -
 8
8 -
 9
9 -
 10
10 -
 11
11 -
 12
12 -
 13
13 -
 14
14 -
 15
15 -
 16
16 -
 17
17 -
 18
18 -
 19
19 -
 20
20 -
 21
21 -
 22
22 -
23
-
24
-
25
-
26
-
27
-
28
-
29
-
30
-
31
-
32
-
33
-
34
-
35
-
36
-
37
-
38
-
39
-
40
-
41
-
42
-
43
-
44
-
45
-
46
-
47
-
48
-
49
-
50
-
51
-
52
-
53
-
54
-
55
-
56
-
57
-
58
-
59
-
60
-
61
-
62
-
63
-
64
-
65
-
66
-
67
-
68
-
69
-
70
-
71
-
72
-
73
-
74
-
75
-
76
-
77
-
78
-
79
-
80
-
81
-
82
-
83
-
84
-
85
-
86
-
87
-
88
-
89
-
90
-
91
-
92
-
93
-
94
-
95
-
96
-
97
-
98
-
99
-
100
-
101
-
102
-
103
-
104
-
105
-
106
-
107
-
108
-
109
-
110
-
111
-
112
-
113
-
114
-
115
-
116
-
117
-
118
-
119
-
120
-
121
-
122
-
123
-
124
-
125
-
126
-
127
-
128
-
129
-
130
-
131
-
132
-
133
-
134
-
135
-
136
-
137
-
138
-
139
-
140
-
141
-
142
-
143
-
144
-
145
-
146
-
147
-
148
-
149
-
150
-
151
-
152
-
153
-
154
-
155
-
156
 |
 |

FINANCIAL
FINANCIAL
HIGHLIGHTS
HIGHLIGHTS
DOLLARS IN THOUSANDS–EXCEPT PER SHARE AMOUNTS
FINANCIAL HIGHLIGHTS 2013 2011 2010 2009
OPERATING HIGHLIGHTS
TOTAL COMPANY SALES
CONSOLIDATED SAME
STORE SALES GROWTH
CONSOLIDATED
STORE COUNT
PROFESSIONAL DISTRIBUTOR
SALES CONSULTANTS
Net Sales
Same Store Sales Growth(1)
Number of Stores (end of period)
Sally Beauty Supply 2,230,028
1,392,188
3,622,216
1,795,263
49.6
520,362
261,151
310,454
3,424
1,245
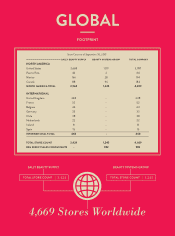
4,669
982
14.4
-0.6
4.2
0.8
1.52
1.48
2012
2,198,468
1,325,176
3,523,644
1,743,259
49.5
499,355
233,064
297,582
3,309
1,190
4,499
1,044
14.2
6.5
6.1
6.4
1.27
1.24
2,012,407
1,256,724
3,269,131
1,594,605
48.8
448,469
213,725
291,841
3,158
1,151
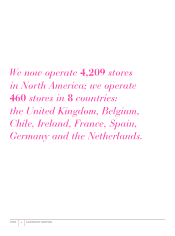
4,309
1,116
13.7
6.3
5.5
6.1
1.17
1.14
1,834,631
1,081,459
2,916,090
1,404,374
48.2
340,930
143,828
217,476
3,032
1,027
4,059
1,051
11.7
4.1
6.2
4.6
0.79
0.78
1,695,652
940,948
2,636,600
1,243,317
47.2
296,836
99,117
223,333
2,923
991
3,914
1,022
11.3
2.1
1.0
1.8
0.55
0.54
Sally Beauty Supply
Sally Beauty Supply
Consolidated Gross Profit
Operating Earnings Margin
Operating Earnings
Gross Profit Margin
Consolidated Net Earnings
Net Earnings Per Diluted Share
Beauty Systems Group
Beauty Systems Group
Beauty Systems Group
Net Earnings Per Basic Share
Cash Flow From Operations
Fiscal Year Ended September 30
(1) Same stores are defined as company-operated stores that have been open for at least 14months as of the last day of a month.
PAGE 8 SALLY BEAUTY HOLDINGS
$ $ $ $ $
$ $ $ $ $
$ $ $ $ $
$ $ $ $ $
$ $ $ $ $
$ $ $ $ $
$ $ $ $ $
$ $ $ $ $
$ $ $ $ $
% % % % %
% % % % %
% % % % %
% % % % %
% % % % %