Sallie Mae 2014 Annual Report Download - page 121
Download and view the complete annual report
Please find page 121 of the 2014 Sallie Mae annual report below. You can navigate through the pages in the report by either clicking on the pages listed below, or by using the keyword search tool below to find specific information within the annual report.-
 1
1 -
2
-
3
-
4
-
5
-
6
-
7
-
8
-
9
-
10
-
11
-
12
-
13
-
14
-
15
-
16
-
17
-
18
-
19
-
20
-
21
-
22
-
23
-
24
-
25
-
26
-
27
-
28
-
29
-
30
-
31
-
32
-
33
-
34
-
35
-
36
-
37
-
38
-
39
-
40
-
41
-
42
-
43
-
44
-
45
-
46
-
47
-
48
-
49
-
50
-
51
-
52
-
53
-
54
-
55
-
56
-
57
-
58
-
59
-
60
-
61
-
62
-
63
-
64
-
65
-
66
-
67
-
68
-
69
-
70
-
71
-
72
-
73
-
74
-
75
-
76
-
77
-
78
-
79
-
80
-
81
-
82
-
83
-
84
-
85
-
86
-
87
-
88
-
89
-
90
-
91
-
92
-
93
-
94
-
95
-
96
-
97
-
98
-
99
-
100
-
101
-
102
-
103
-
104
-
105
-
106
-
107
-
108
-
109
-
110
-
 111
111 -
 112
112 -
 113
113 -
 114
114 -
 115
115 -
 116
116 -
 117
117 -
 118
118 -
 119
119 -
 120
120 -
 121
121 -
 122
122 -
 123
123 -
 124
124 -
 125
125 -
 126
126 -
 127
127 -
 128
128 -
 129
129 -
 130
130 -
 131
131 -
132
-
133
-
134
-
135
-
136
-
137
-
138
-
139
-
140
-
141
-
142
-
143
-
144
-
145
-
146
 |
 |

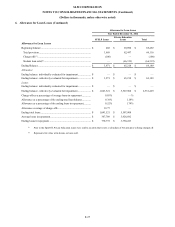
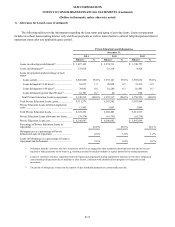
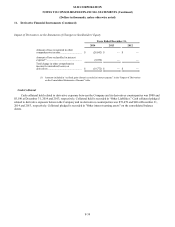
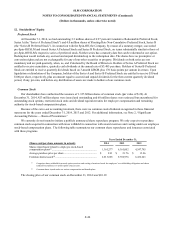
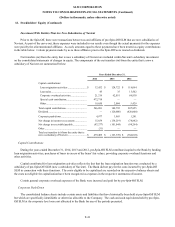
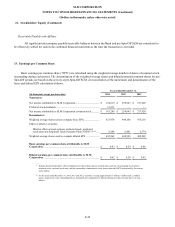
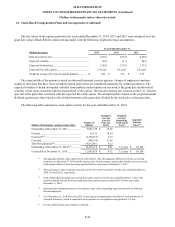
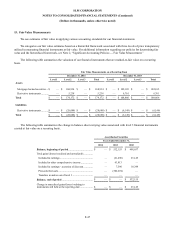
SLM CORPORATION
NOTES TO CONSOLIDATED FINANCIAL STATEMENTS (Continued)
(Dollars in thousands, unless otherwise noted)
11.
Derivative Financial Instruments (Continued)
Impact of Derivatives on the Consolidated Balance Sheet
Cash Flow Hedges
Fair Value Hedges
Trading
Total
December
31,
December
31,
December
31,
December
31,
December
31,
December
31,
December
31,
December
31,
2014
2013
2014
2013
2014
2013
2014
2013
Fa ir Va lues
(1)
Hedged
Risk
Exposure
Derivative
Assets:
(2)
Interest rate
swaps .........
Interest
rate
$
—
$
—
$
5,012
$
6,335
$
226
$
426
$
5,238
$
6,761
Derivative
Liabilities:
(2)
Interest rate
swaps .........
Interest
rate
(21,435
)
—
(5,883
)
(6,149
)
(1,370
)
—
(28,688
)
(6,149
)
Total net
derivatives .....
$
(21,435
)
$
—
$
(871
)
$
186
$
(1,144
)
$
426
$
(23,450
)
$
612
(1) Fair values reported are exclusive of collateral held and pledged and accrued interest. Assets and liabilities are presented without consideration of master
netting agreements. Derivatives are carried on the balance sheet based on net position by counterparty under master netting agreements, and classified in
other assets or other liabilities depending on whether in a net positive or negative position.
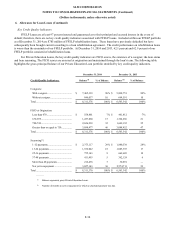
(2) The following table reconciles gross positions with the impact of master netting agreements to the balance sheet classification:
Other Assets
Other Liabilities
December 31,
December 31,
December 31,
December 31,
2014
2013
2014
2013
Gross position ...........................
$
5,238
$
6,761
$
(28,688
)
$
(6,149
)
Impact of master netting agreement ..
(4,045
)
(4,981
)
4,045
4,981
Derivative values with impact of
master netting agreements (as
carried on balance sheet) ...............
1,193
1,780
(24,643
)
(1,168
)
Cash collateral (held) pledged
(1)
......
(900
)
(5,190
)
72,478
40
Net position ..............................
$
293
$
(3,410
)
$
47,835
$
(1,128
)
(1) Cash collateral amount calculations include outstanding accrued interest payable/receivable.
F-37