Ricoh 2000 Annual Report Download - page 4
Download and view the complete annual report
Please find page 4 of the 2000 Ricoh annual report below. You can navigate through the pages in the report by either clicking on the pages listed below, or by using the keyword search tool below to find specific information within the annual report.-
 1
1 -
 2
2 -
 3
3 -
 4
4 -
 5
5 -
 6
6 -
 7
7 -
 8
8 -
 9
9 -
 10
10 -
 11
11 -
 12
12 -
 13
13 -
 14
14 -
 15
15 -
16
-
17
-
18
-
19
-
20
-
21
-
22
-
23
-
24
-
25
-
26
-
27
-
28
-
29
-
30
-
31
-
32
-
33
-
34
-
35
-
36
-
37
-
38
-
39
-
40
-
41
-
42
-
43
-
44
-
45
-
46
-
47
-
48
-
49
-
50
-
51
-
52
-
53
-
54
-
55
-
56
-
57
-
58
-
59
-
60
 |
 |

2
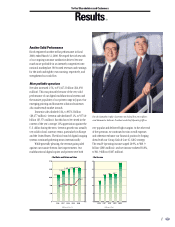
Basic net income per share was ¥60.61 ($0.59), and
fully diluted net income per share was ¥56.06 ($0.54).
Return on shareholders’ investment jumped from
6.4% to 8.1%.
We maintained cash dividends per share of common
stock at ¥11.00 ($0.11). At the annual general meeting of
shareholders on June 29, 2000, shareholders approved our
decision to translate retained earnings into more solid
operational and financial fundamentals. Some of these
are described below.
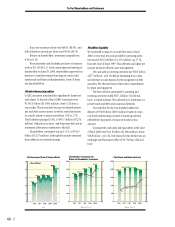
A better financial position
G-C&C initiatives translated into significantly leaner bal-
ance sheets. At the end of fiscal 2000, total assets were
¥1,543.3 billion ($14,984 million), down 5.2% from a
year earlier. This was mainly because we slashed invento-
ries and other current assets, as well as some fixed assets.
As a result, return on assets soared from 1.9% to 2.7%.
Total liabilities plunged 13.4%, to ¥955.5 billion ($9,276
million). Reductions in short- and long-term debt and in
retirement allowances contributed to this fall.
Shareholders’ investment was up 11.1%, to ¥541.5
billion ($5,257 million), although this mainly stemmed
from additions to retained earnings.
Healthier liquidity
We continued to improve our cash flow mix in fiscal
2000. At year-end, net cash provided by operating activi-
ties stood at ¥135.6 billion ($1,317 million), up 27.1%
from the close of fiscal 1999. This reflected our higher net
income and more efficient asset management.
Net cash used in investing activities was ¥28.5 billion
($277 million), a 68.1% decline stemming from a mas-
sive decrease in cash deposits for the assignment of debt
securities. We allocated most of this cash to expenditures
for plant and equipment.
The free cash flow generated by operating and
investing activities totaled ¥107.2 billion ($1,040 mil-
lion), a sixfold increase. This allowed us to reimburse cor-
porate bonds and debts and maintain dividends.
Our cash flow for the year included additional
deposits of ¥50.0 billion ($485 million) based on corpo-
rate bond underwriting contracts. Financing activities
reflected the repayment of corporate bonds for this
amount.
Consequently, cash and cash equivalents at the close
of fiscal 2000 were ¥111.8 billion ($1,086 million), down
¥18.8 billion, or 14.4%. One reason for this decline was an
exchange-rate fluctuation effect of ¥4.7 billion ($46 mil-
lion).
To Our Shareholders and Customers
0
120
240
360
480
600
1996
401.5
1997
422.9
1998
475.0
1999
487.5
2000
541.5
0
2
4
6
8
10
5.6
7.0 6.7 6.4
8.1
(Billions of Yen, %)
0
400
800
1200
1600
2000
1996
1508.5
1997
1644.9
1998
1660.5
1999
1628.0
2000
1543.3
0
1
2
3
4
5
1.4
1.8 1.8 1.9
2.7
•Total Assets and Return on Assets
(Billions of Yen, %)
1996
33.55
1997
44.16
1998
44.97
1999
44.33
2000
60.61
44.33
60.61
0
14
28
42
56
70
31.21
38.95 41.35 40.94
56.06
•Net Income per Share of Common Stock
(Yen)
Basic Diluted
•Shareholders’ Investment and
Return on Shareholders’ Investment