Ricoh 2000 Annual Report Download - page 3
Download and view the complete annual report
Please find page 3 of the 2000 Ricoh annual report below. You can navigate through the pages in the report by either clicking on the pages listed below, or by using the keyword search tool below to find specific information within the annual report.-
 1
1 -
 2
2 -
 3
3 -
 4
4 -
 5
5 -
 6
6 -
 7
7 -
 8
8 -
 9
9 -
 10
10 -
 11
11 -
 12
12 -
 13
13 -
 14
14 -
15
-
16
-
17
-
18
-
19
-
20
-
21
-
22
-
23
-
24
-
25
-
26
-
27
-
28
-
29
-
30
-
31
-
32
-
33
-
34
-
35
-
36
-
37
-
38
-
39
-
40
-
41
-
42
-
43
-
44
-
45
-
46
-
47
-
48
-
49
-
50
-
51
-
52
-
53
-
54
-
55
-
56
-
57
-
58
-
59
-
60
 |
 |

1
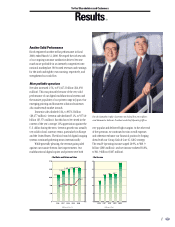
Another Solid Performance
Ricoh registered another stellar performance in fiscal
2000, ended March 31, 2000. We reaped the rich rewards
of our ongoing customer satisfaction drive to become
much more profitable in an intensely competitive inter-
national marketplace. We boosted revenues and earnings
for the sixth and eighth years running, respectively, and
strengthened our cash flow.
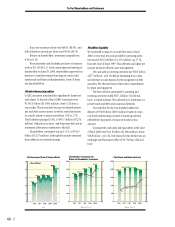
More profitable operations
Net sales increased 1.5%, to ¥1,447.2 billion ($14,050
million). This was primarily because of the very solid
performance of our digital multifunctional systems and
the massive popularity of our printer range in Japan. Our
emerging printing and document solutions businesses
also made steady market inroads.
Domestic sales climbed 6.4%, to ¥873.2 billion
($8,477 million). Overseas sales declined 5.1%, to ¥574.0
billion ($5,573 million). But this has to be viewed in the
context of the yen’s average 13% appreciation against the
U.S. dollar during the term. Overseas growth was actually
very solid in local-currency terms, particularly in Europe
and the United States. The Aficio brand of digital imaging
systems continued gathering steam internationally.
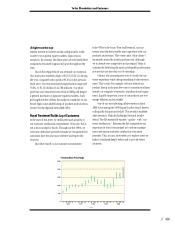
While generally pleasing, the revenue gains paled
against our massive bottom-line improvements. Our
multifunctional digital copiers and printers were both
very popular and delivered high margins. At the other end
of the spectrum, we continued to trim overall expenses
and otherwise enhance our financial position by forging
ahead with our Group Cash & Cost (G-C&C) strategy.
The result? Operating income surged 20.9%, to ¥88. 9
billion ($863 million), and net income rocketed 36.8%,
to ¥41.9 billion ($407 million).
To Our Shareholders and Customers
Results
0
350
700
1050
1400
1750
1996
1,113.0
1997
1,316.1
1998
1,403.3
1999
1,426.0
2000
1,447.2
0
1
2
3
4
5
2.0 2.2 2.1 2.1
2.9
•Net Sales and Return on Sales
(Billions of Yen, %)
1996
21.9
1997
28.9
1998
30.1
1999
30.7
2000
41.9
0
9
18
27
36
45
•Net Income
(Billions of Yen)
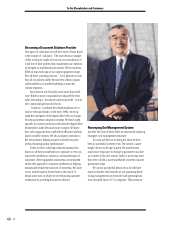
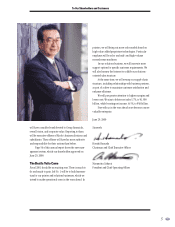
Hiroshi Hamada (right), Chairman and Chief Executive Officer,
and Masamitsu Sakurai, President and Chief Operating Officer